Last Updated: 01 Sep 2024
Table of Contents
Abstract
Objective: This study aimed to investigate the impact of aspartame on short-term cognitive performance.
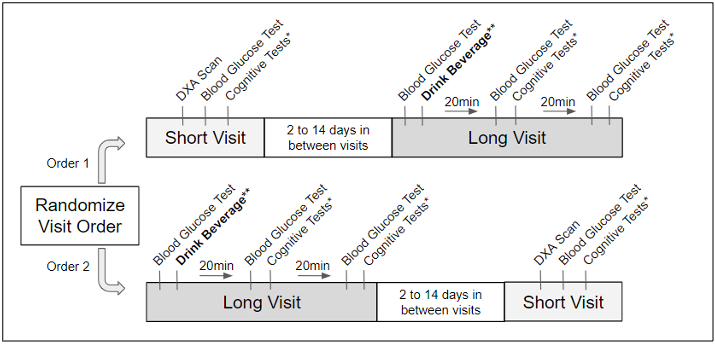
Methods: Employing a randomized-controlled, double-blind design, 130 participants underwent two study visits (order randomized). The short visit included a DXA scan, fasting blood glucose (BG) testing, and cognitive assessments from the NIH-toolbox. During the long visit,participants underwent fasting BG testing before consuming a 500mL beverage of either 0.05% aspartame solution, 11% sucrose solution, or water (beverage group randomized). BG tests and cognitive assessments were completed twice more, at 20-minutes post-beverage consumption (20m PC) and 60-minutes post-beverage consumption (60m PC).
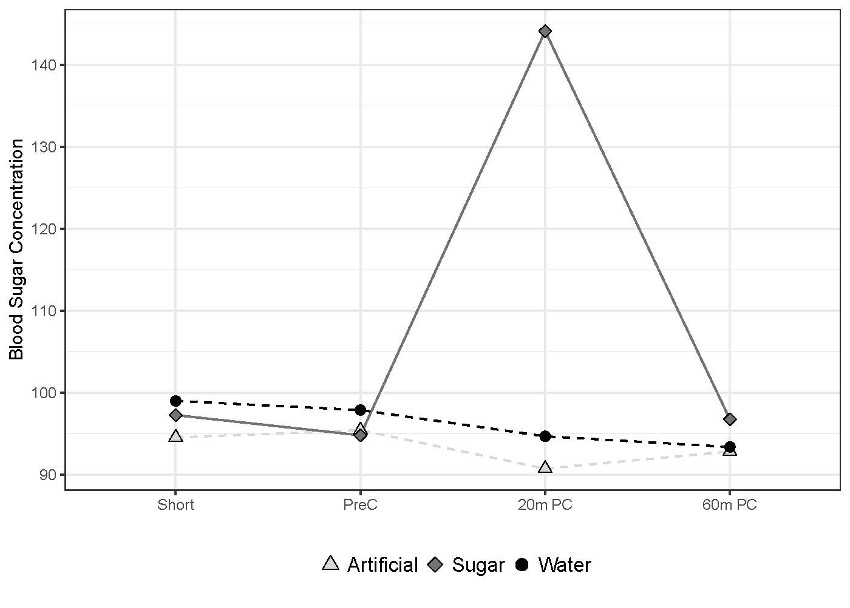
Results: BG responses were as predicted, with participants in the water and aspartame groups responding similarly remaining at fasting levels, and sucrose creating a spike in BG at 20m PC and returning to baseline by 60m PC (p < 0.0001). We found no group differences in cognitive performance at any time point (p = 0.6172). Cognitive test performance improved from the first test to subsequent tests regardless of beverage condition (p < 0.0001).
Conclusion: Although we found no group differences in short-term cognitive performance as a function of sweetener condition, more research is needed to determine the short and long-term cognitive effects of artificial sweeteners.
Introduction
The Department of Nutrition, Dietetics, and Food Science at Brigham Young University aimed to determine in this study the effects of the AS aspartame, the caloric sugar sucrose, and water on short-term cognitive performance. In addition, glucose samples were collected as both a process measure and to correlate changes in blood glucose with any changes in cognitive performance. They hypothesized that an 11% sucrose-sweetened beverage would improve cognitive performance after a fasted state (as glucose levels rise) compared to the 0.05% aspartame-sweetened beverage or water ~20, and ~40 minutes post-consumption. Due to the varied nature of how tests were administered, and to control for a gaining comfort in the testing administration (i.e. a “learning” effect), the time by which treatment was administered was also randomized in two different order sets. The bottom figure displays the details of how this experiment was designed.
The anticipated results were that glucose would react positively for cognitive faculty, and aspartame and water would react negligibly or even show decline.
I served as the main research assistant over statistical analysis, and my role was to organize their laboratory data and test and analyze their hypotheses. Over the course of a year and a half, I have cleaned messy data, manipulated variables, performed and fitted varying models, and described the results in tables, graphics, and writing. My progress was regularly checked by my statistics professor/advisor, and I regularly communicated work to the student-researchers and professor in the NDFS Department.
Over this period of time, our research team expanded their research hypotheses and questions. The statistical methods I used are aimed towards answering the following:
- Is there some effect from drink content on cognitive outcomes?
- Do the drinks influence the cognitive domains uniquely, such as executive function, memory, attention, or processing speed?
- How do drinks affect the BGC (blood glucose concentration) in participants after fasting for an extended period of time?
- How is BGC related to cognitive scoring?
- How are certain body characteristics related to BGC or cognitive scoring?
Our research paper highlighted and answered these questions. The R programming project goes through each of these questions and reveals the processes by which we came to each conclusion.
My main goal for this blog post is two-fold: to summarize the results from the research paper with a touch of a mathematical perspective, and to provide the basic statistical coding, concepts, and other material utilized in the project in the GitHub Repository.
Methods
Two main statistical anaylsis methods were dominated the research paper. The linear mixed effect model (from R package library(nlme)) was utilized to determine the effects of experimental treatments, while controlling for nuisance factors, such as subject (blocking), order, and session time. The mixed effect model was then imported into the type III ANOVA (from library(carr)), which is a more conservative form of type I ANOVA as it determines the significance of a particular variable AFTER adjusting for the other variables in the model. Each test was a straightforward process: I would fit the model, making sure to adjust for the subject, and then ingested the newly created model into the ANOVA.
library(nlme)
library(carr)

my_lme <- lme(CogScore ~ Session_Time * Condition, fixed = ~1|Subject, data = cognition_data)
# * includes the single terms AND the interaction in the lme model

my_anova <- Anova(my_lme, type = "III")
print(my_anova)
I used this format to test numerous potential variables, and not just condition. These include age, sex, features on body composition, and lifestyle factors. We report very few of these findings in the paper.
Visuals and Analysis
First thing researchers confirmed was whether the drinks had the required physiological influence. With the hypothesis directing whether glucose influences cognitive outcomes, the glucose strip readings were essential for determing if the four breakpoints and three drinks reacted as expected. In the figure below, the sugar drink had a huge spike (50+ jump) in BGC at the 20m PC (post-consumption) session, compared to water and aspartame. This drink then dropped suddenly at 40m PC, aligning with how quickly sugar would be consumed with a young adult subject during a fasted state.
There are seven tests that are common for assessing cognitive faculty in subjects, sometimes for study involving cognitive recovery or decline from neurological disease like dementia. In this case, we used these tests simply for assessing cognitive abilities. From the NIH Toolbox Cognition Battery, the seven tests include the following: the Picture Sequence Memory Test (PSM) for episodic memory, the Flanker Inhibitory Control Test (FICA) for executive function and attention, the List Sort Working Memory Test (LSWM) for working memory, the Dimensional Change Card Sort Test (DCCS) for executive function, the Pattern Comparison Processing Speed Test (PCPS) for processing speed, the Rey Auditory Verbal Learning Test (AVLT) for immediate recall, and the Oral Symbol Digit Test (OSD) for processing speed. The “Fluid Cognition Composite” score is a measurement of fluid abilities, which evaluates a subject’s ability to solve problems, think and act quickly, and encode new episodic memory. You can view additional details about each test from the NIH Toolbox Cognitive Test Manual.
The next figure deciphers how the cognitive outcomes related to each drink and testing order. Note: “Short-1” and “Short-2” indicate the control testing assessment for when the subject is under no treatment.
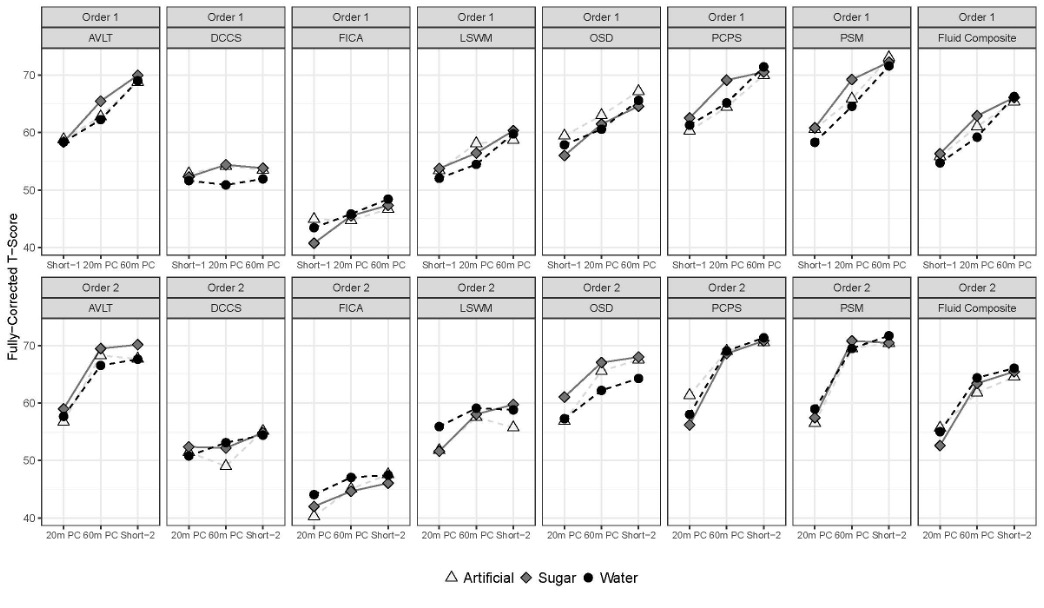
This figure introduces the linear mixed effects model and how we determined treatment effects. According to our model and imported into a Type III ANOVA, we found that of the variables that responded to cognitive score, session time was significant influencing virtually every test (p < 2e-16). Condition alone, and condition reactant to session, were insignificant (p = 0.84, p = 0.62). This indicates that because of our model’s ability to isolate nuisnace factors such as subject, session time, and other experimental variables, we are able to discover that the drink treatments had null psychological effect on college-aged subjects.
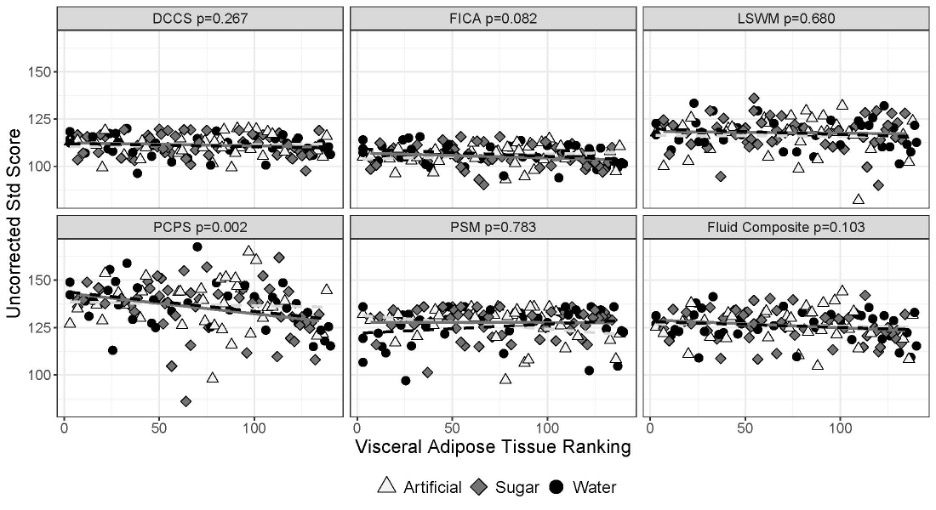
In addition to our research in the treatment, we were able to discover an element within person’s physique that influences PCPS (processing speed). A subject’s visceral adipose tissue (or VAT) is inversely correlated with their ability to react and process information (p = 0.002). The same process applied in discovering this trend: we fit a linear mixed effects model, now including the VAT of the subject and evaluating each test score. Instead of using the raw value for VAT, we used their ranking or position within the sample of their VAT. This was to control for outliers or skew.
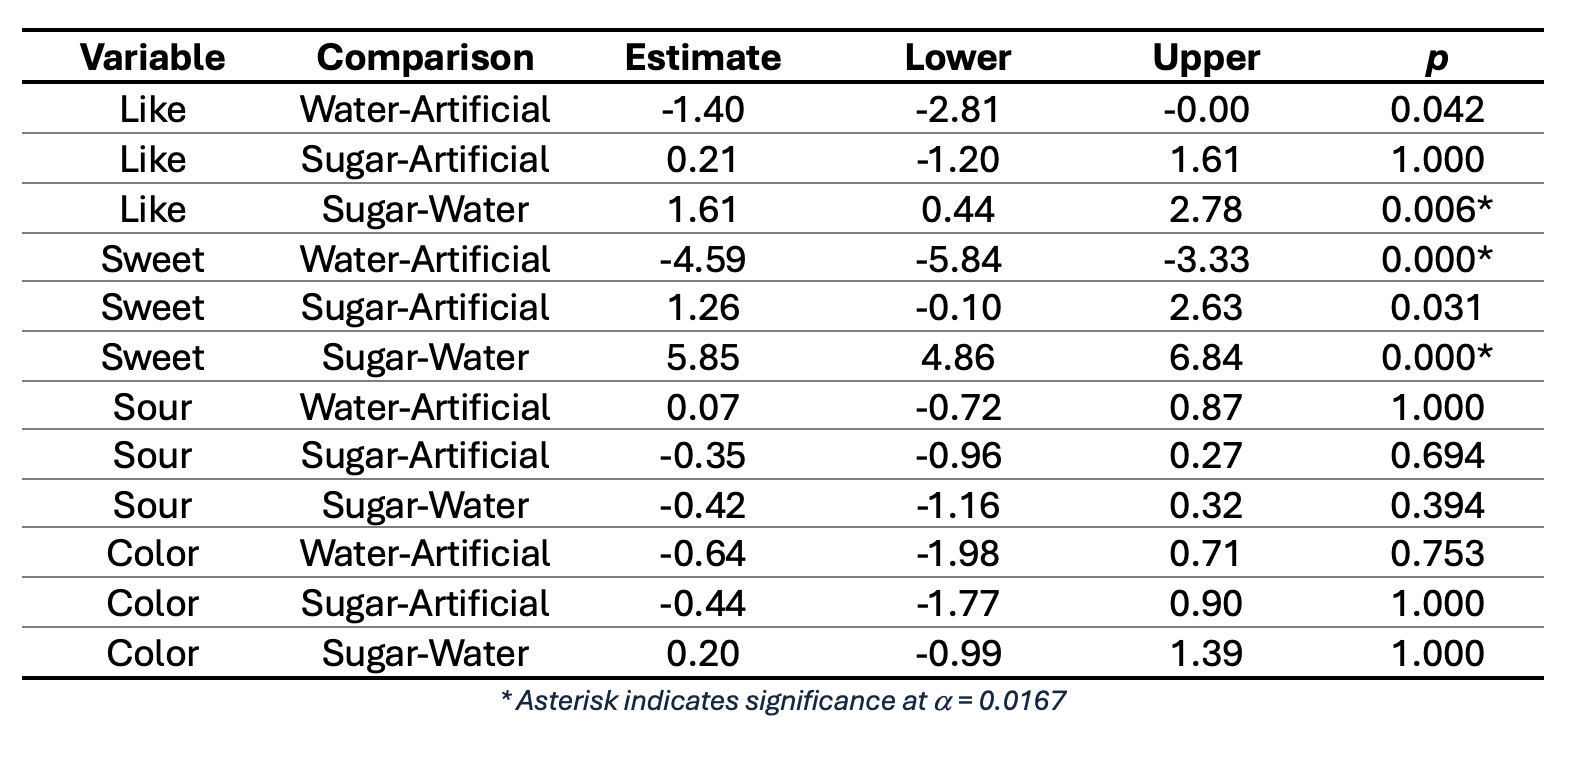
Finally, we compared subject perception of the drinks using a visual analog score (VAS). VAS measured on a 1-10 scale how much subjects liked their drinks, how sweet it tasted, how sour it was, and what they think of the color. We used Bonferroni pairwise comparisons to evaluate how different treatments scored for these fourd domains.
According to the table below, subjects perceived the taste for the sugar drink to be higher than that of plain water (p = 0.006). This makes sense as all biological organisms, including humans, have receptors (or taste buds) that indicate whether a food is substantive or not. This might also be why the comparison for artificial sweetener to water for taste is noticably different, but not significant (p = 0.042). When comparing perceived sweetness, both sugar and artificial sweeteners scored higher than water (p < 1e-4 and p < 1e-4). The difference in perceived sweetness was higher for sugar than aspartame, but this perception was not significantly different (p = 0.031). No differences were discovered between drinks and sourness/color (note: all drinks received pink food dye to control for any placebo effect, so no differences among color fits with expectations).
Conclusion
We explored the general experimental process for this BYU Nutritional Science study, viewed a simplified version of the coding done to test conditions, and generated visuals of the study results. Overall, no effect was determined from a short-term cognitive standpoint on college students from consuming different generically consumed drinks. While we did not determine any findings from treatments, we did learn that the conditions behaved as expected, generating spikes in subjects’ glucose concentrations and having the expected perceived taste and reaction. The mixed model method also aided us in finding a correlative feature between VAT (visceral adipose tissue) and processing speed.
I am proud to have made this my first exposure to academic research and learned a lot about effective research strategies and conveying results to broader audiences. The study also became a great introduction for the field of psychology and behavior, which I have tremendous interest in.
To access the paper yourself, visit SAGE Journals Perception and Motor Skills.