Last Updated: 08 Apr 2025
Table of Contents
Introduction
This post presents a comprehensive simulation study designed to evaluate outlier detection algorithms under a wide variety of challenging conditions. Specifically, I investigate how well MaMa and competing algorithms perform across different cellwise outlier types (A, B, and C, introduced in Part 2), across different underlying data distributions (MVN, log-MVN, and bimodal MVN, discussed in Part 3), and across different covariance structures (“A09”, “ALYZ”, and “Rho”).
To stress-test these algorithms and compare them to MaMa, I simulate datasets with increasing levels of outlier effect size and outlier rate, then assess each algorithm’s accuracy, precision, recall, and F1 score. This study provides a visual and intuitive way to compare algorithm performance across a massive design space—ideal for anyone designing or choosing an outlier detection method for multi-dimensional data.
Results
For our simulation, we are particularly interested in seeing how MaMa performs against its competitors. Each algorithm’s performance is visualized through line plots, tracking how metrics such as accuracy, precision, recall, and F1 score change under varying conditions. The results are organized into subsections based on outlier type, data distribution, and covariance structure, with two main scenarios analyzed:
Increasing Effect Size:
-
The proportion of outliers is fixed at 5% per column (no duplicate cells).
-
This scenario tests how well algorithms respond to weaker and stronger outliers.
Increasing Outlier Rate:
-
The effect size is held constant (set to 3 for Types A and C, and to min/max for Type B).
-
This scenario evaluates how performance degrades or improves as more outliers are introduced.
Each chart within the subsections illustrates how each algorithm’s performance evolves, helping identify which methods are more robust across different kinds of contamination and data structures.
Type A Outliers
Type A outliers are simply created by altering $X_{ij}$ to be $X_{ij} \pm z*SD(X)$. A higher effect size $z$ creates a more conspicuous outlier.
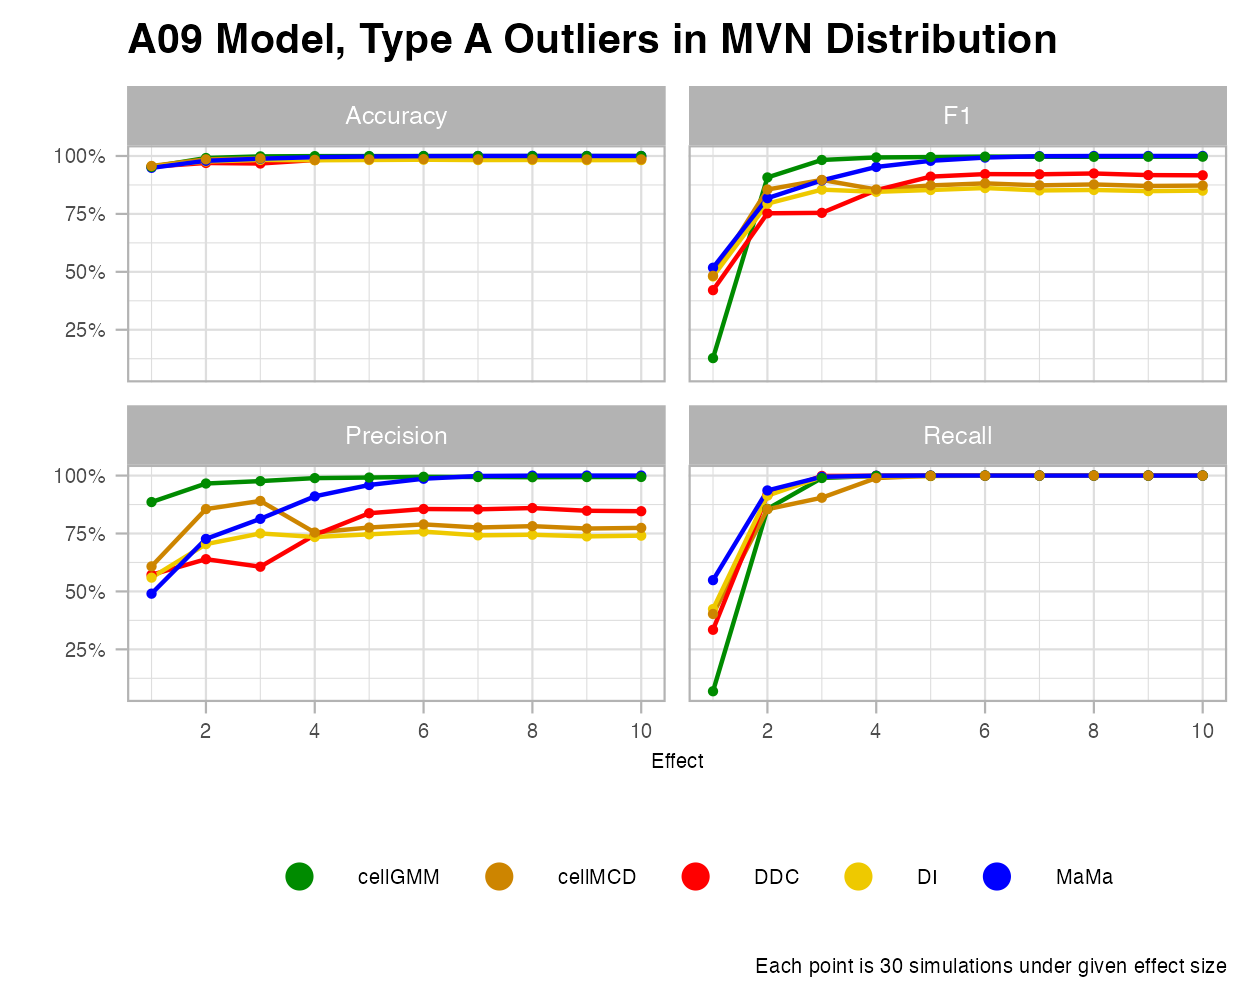
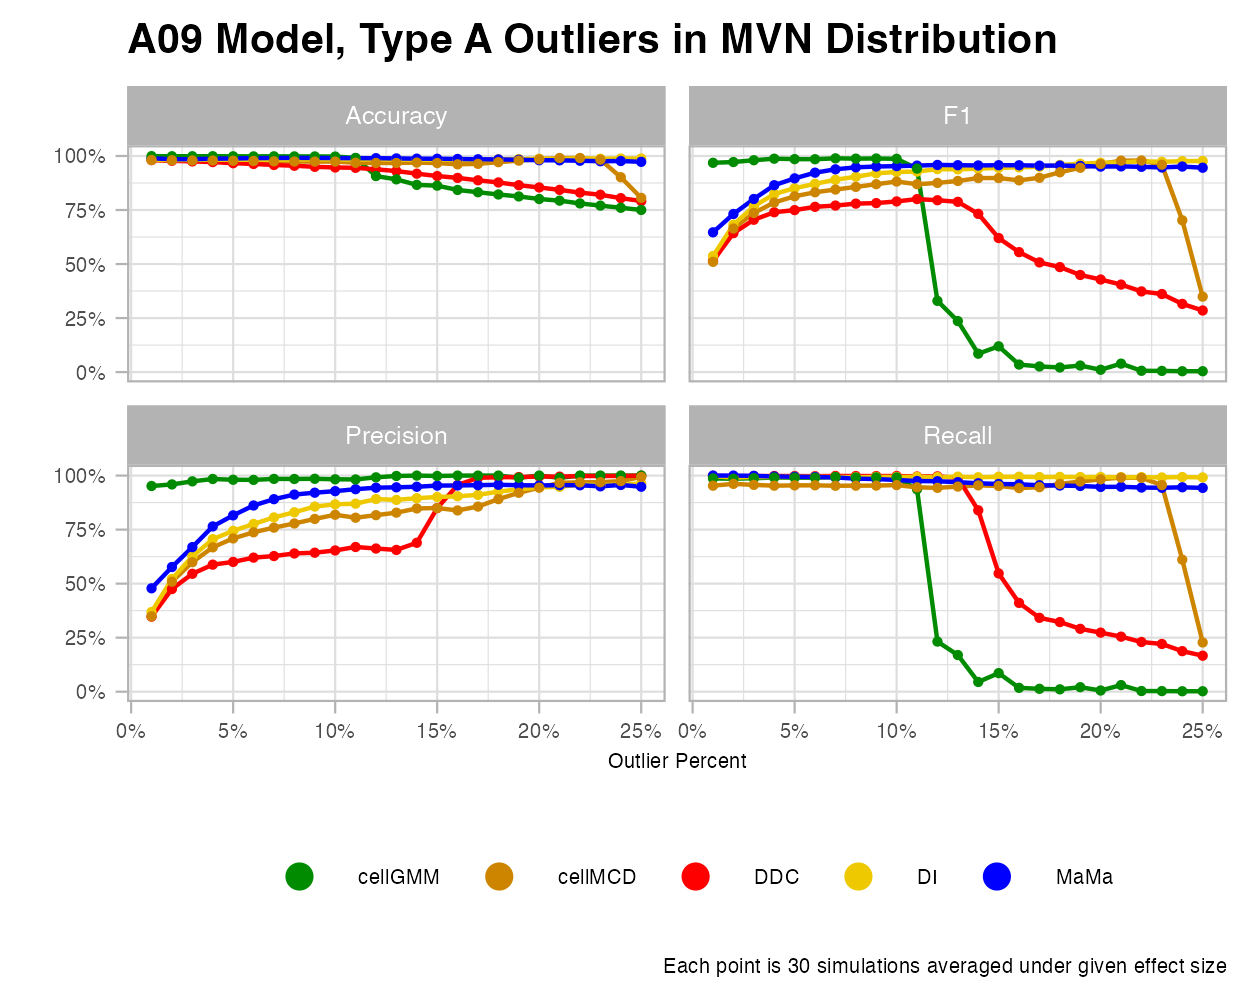
MVN
It’s important to recall that all five algorithms we explore here (cellGMM, cellMCD, DDC, DI, and MaMa), were built to detect cellwise outliers under a standard multivariate normal distribution. Under the effect size figure, we see each algorithm perform exceptionally well. However, some algorithms struggle to handle high contamination. As the contamination of cellwise outliers grow, some of models like cellGMM and DDC tend to struggle greatly. These algorithms do not have explicit hyperparameters that make initial predictions on the rate of contamination.
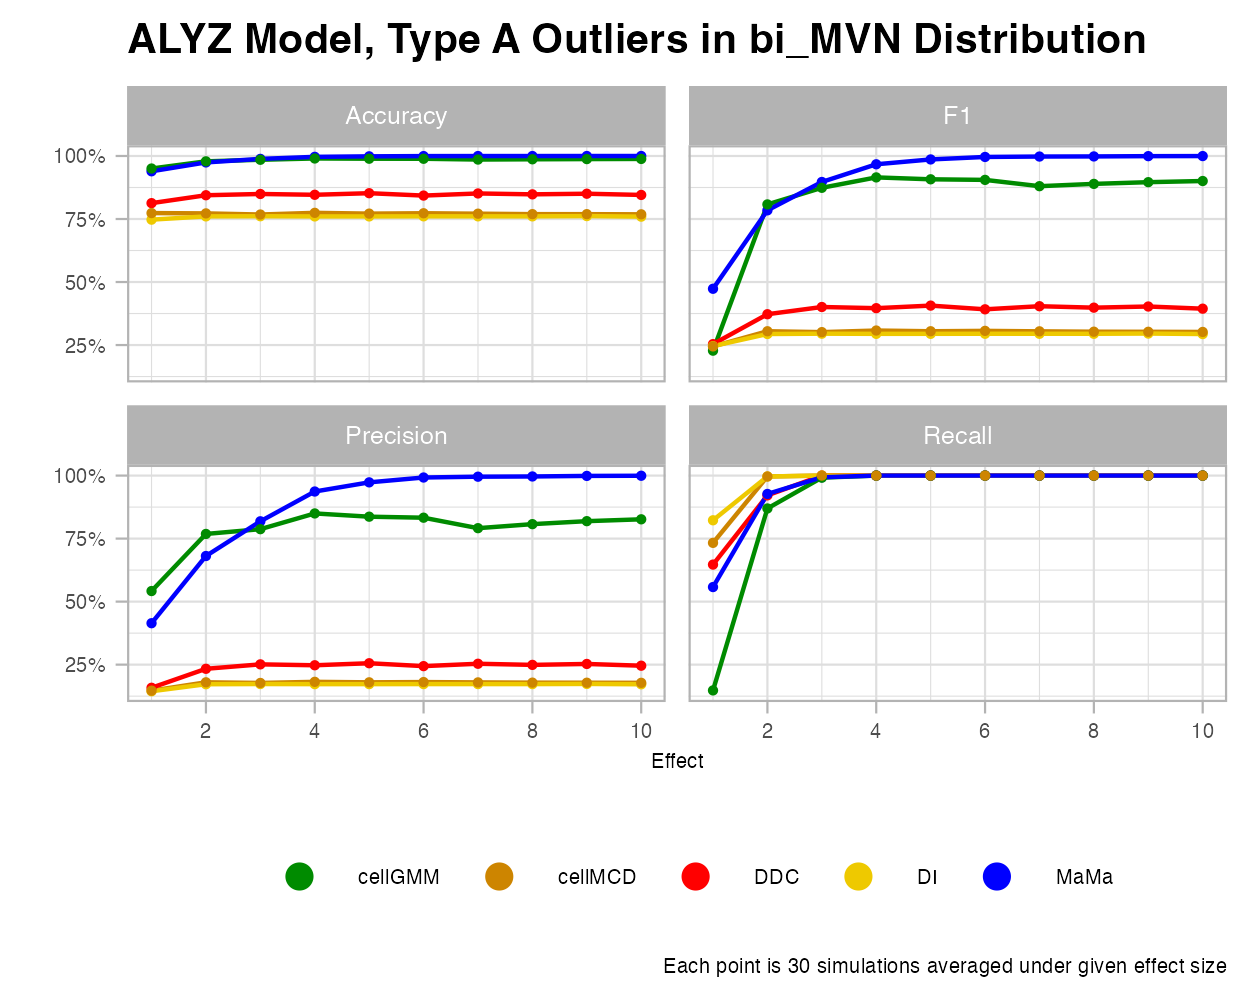
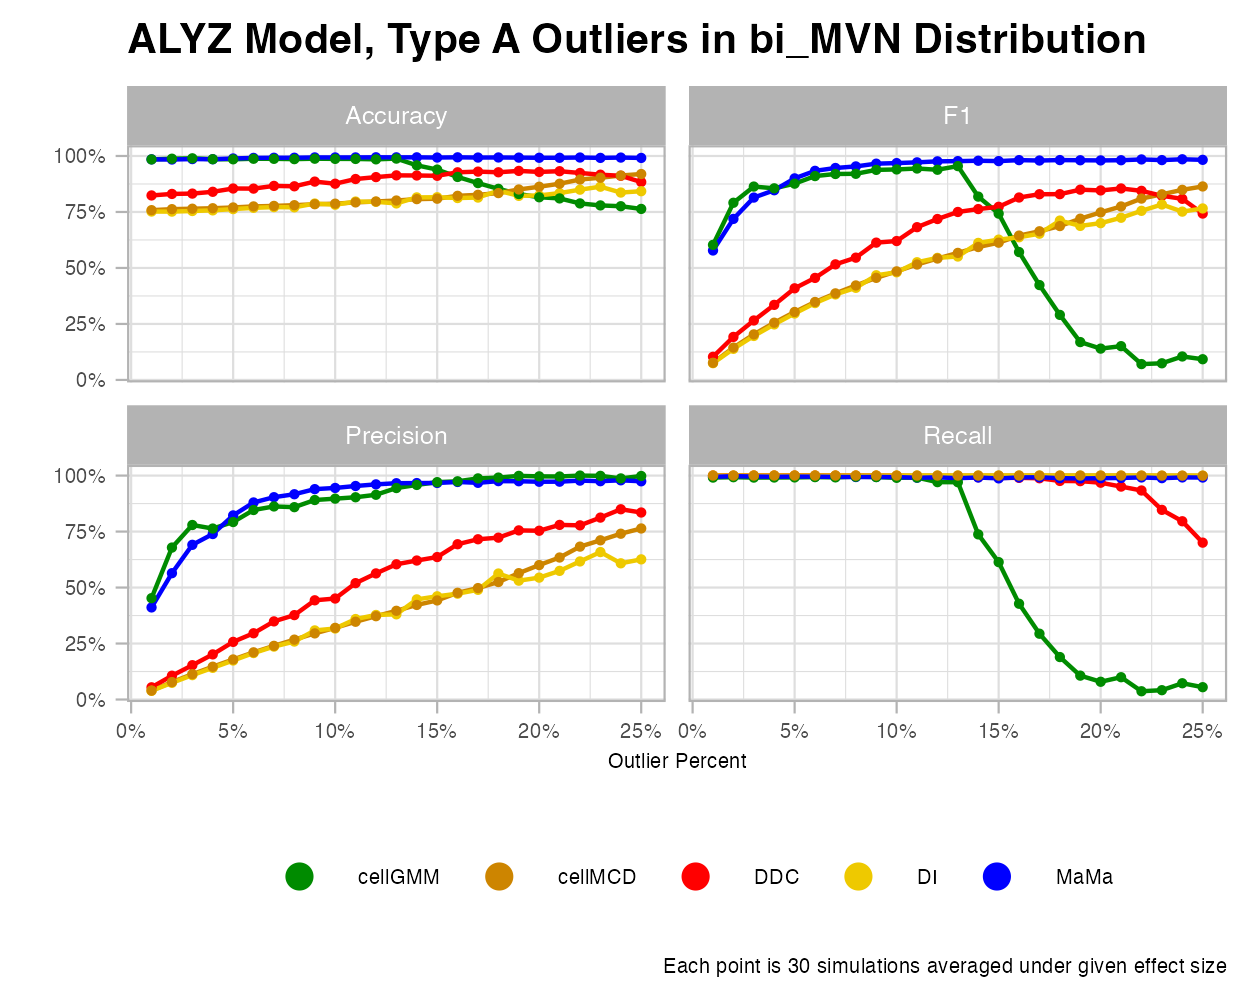
Bimodal MVN
Let’s consider the scenario where we combine two MVN clusters into a dataset. For this case, we see that MaMa and cellGMM do the best under various effect sizes and most outlier rates. Cell GMM was trained to identify outliers under “heterogenous data”, and thus are built to excel in this type of data. However, higher percentages of outliers are a struggle for this algorithm. MaMa seems to handle each of these cases exceptionally well compared to competitors.
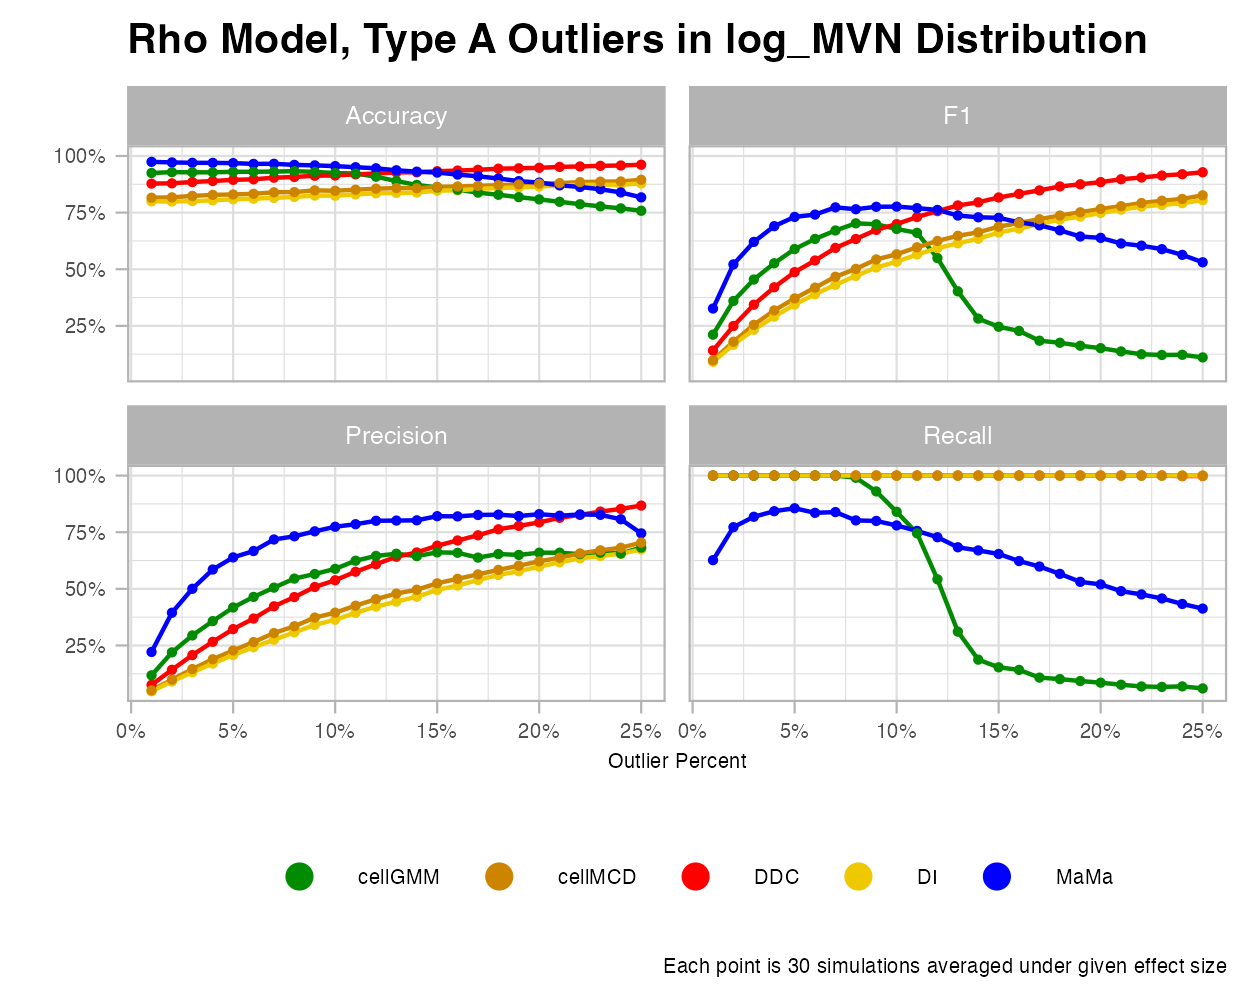
Log MVN
When expanded to a logarithm MVN, MaMa makes promising strides. While detecting outliers gets trickier under this scenario, MaMa is able to pick up on the outlier trend faster than its competitors as the effect size grows. However, predictive accuracy dips downward unforunately under higher rates of outliers. Why is this the case? There is an important concept to establish here: the rate graphic is not to illustrate how MaMa performs worse under higher outlier percentages, but how cellMCD, DDC, and DI fail to establish any connection under ALL outlier rates. Note how precision is stuck at 100% for these three algorithms. Because each algorithm is trained to predict cellwise outliers far from its data center, it fails to determine if the naturally skewed observations found in a log MVN distribution are inliers, which inevitably creates over-sensitive classifications. Thus, the recall is so high, and the precision is so low for lower rates. However, as outlier percentage grows in the study, the trend for precision and F1 increases, making it a more attractive choice on paper, but ultimately not optimal for this type of algorithm. Thus, even though MaMa declines in performance with higher rates, it is very much preferred over these competing algorithms.

Type B Outliers
Type B outliers require much more scrutiny in cleaning. This is because Type B outliers require consideration of the correlation structure of the dataset, as each value, including the cellwise outliers, are within the range of each variable. A Type B outlier is created when a cell value is pulled outside of the correlation structure such that it surpasses the quantile of Mahalanobis distances (MD) found within the true data (more explanation in Part 2). This quantile effect increases from the 90th to the 100th (maximum) to test different predictive outcomes.
For these examples, I decided to use the “A09” covariance matrix as it creates datasets with the greatest amount of multicollinearity, allowing outliers to stand out more and algorithms to be more comparable.
MVN
Under the MVN Type B outliers, we see that MaMa is comparatively underperforming in precision, but doing mediocre in F1 and recall. Interestingly, MaMa performs well under various outlier percentages. While it is less accurate at detecting outliers at the lower rates, it keeps the same consistency under higher rates.
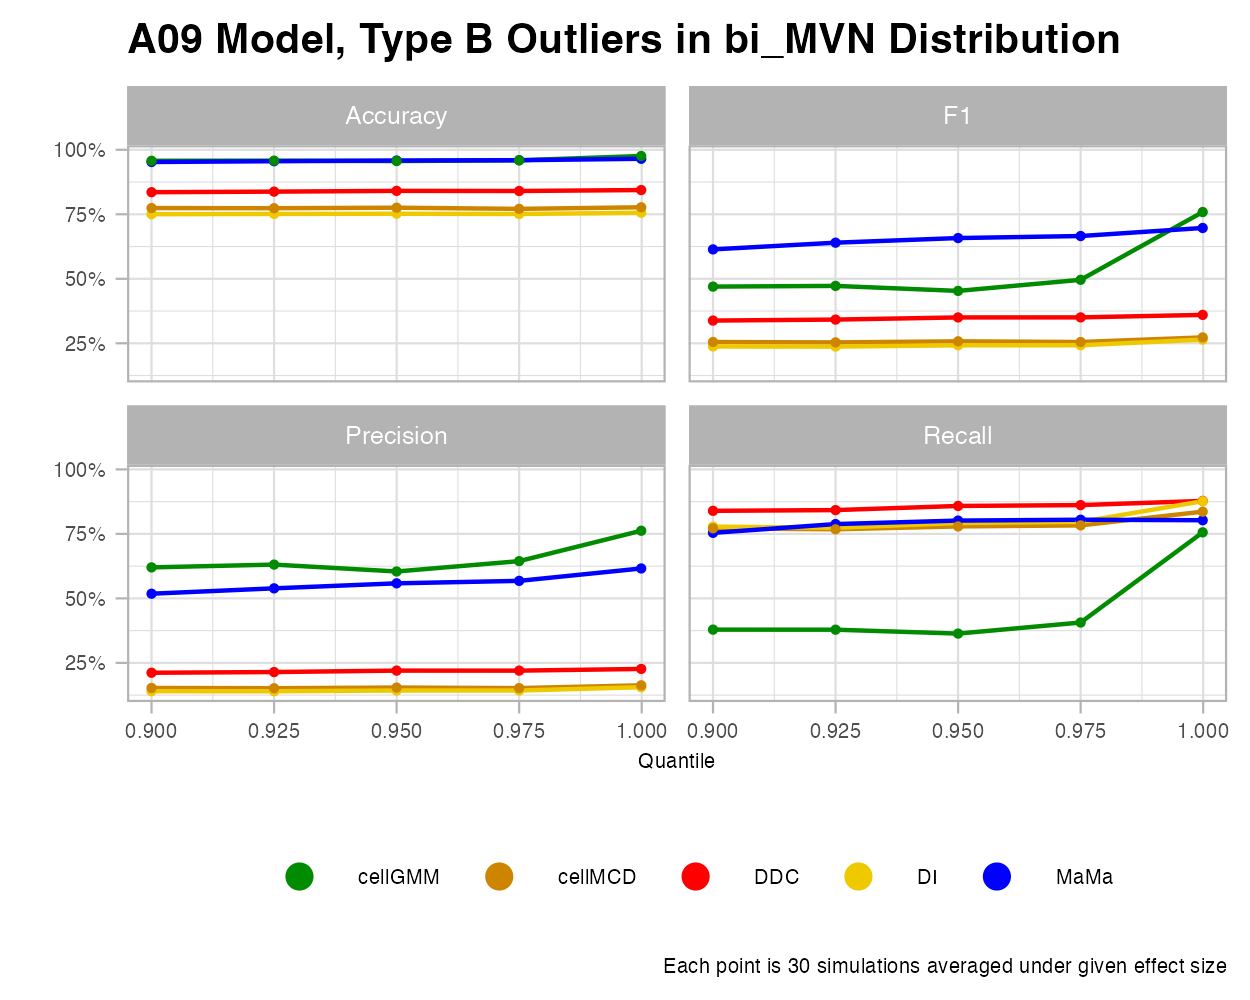
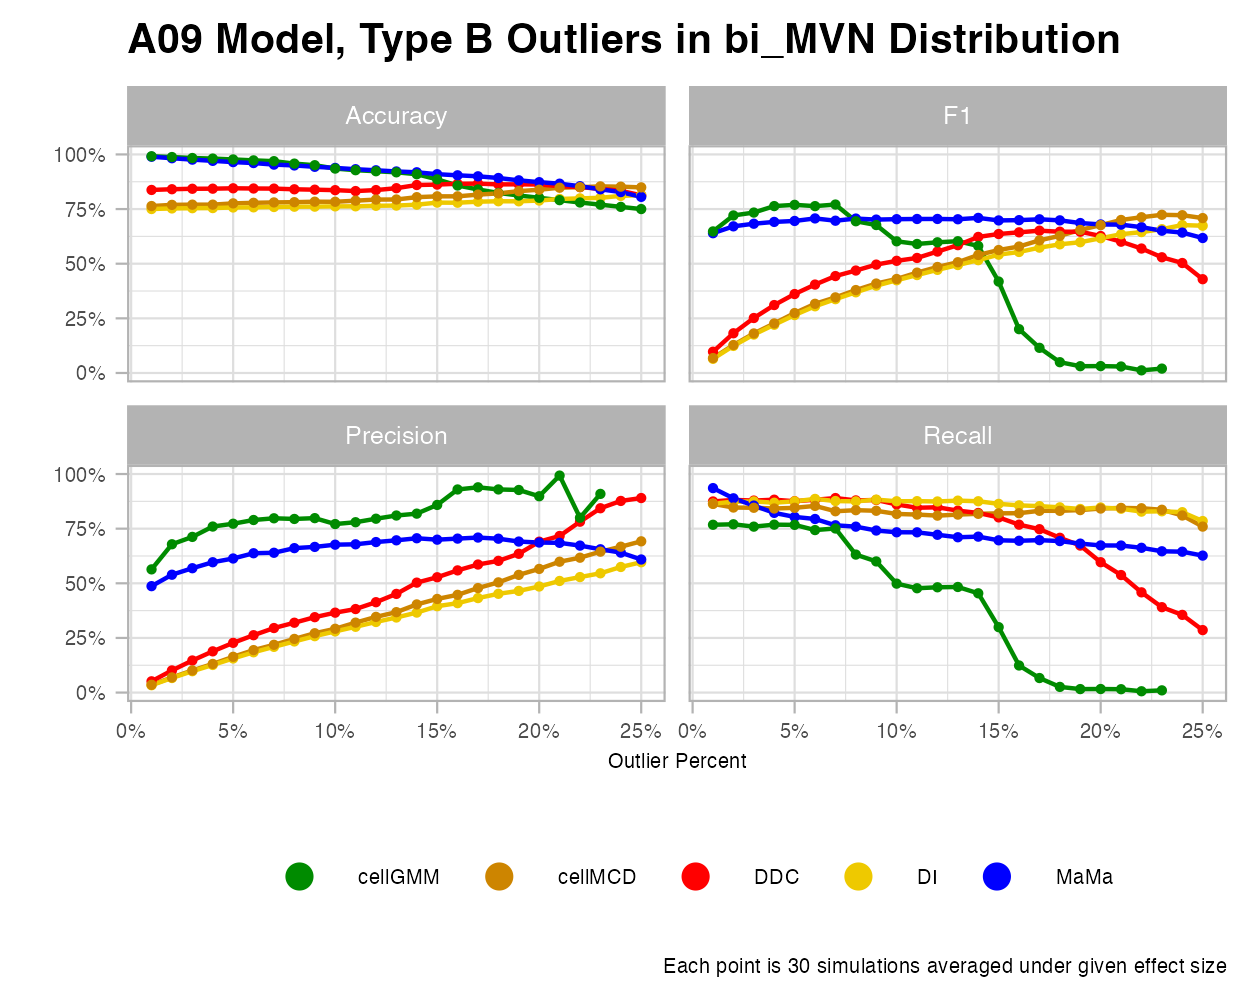
Bimodal MVN
MaMa and Cell GMM perform exceptional in the bimodal case and are almost equally optimal for various MD quantiles. However, cellGMM has a poor recall, so it makes very “safe” classifications for cellwise outliers. Additionally, and similar to the MVN case, MaMa reveals greater consistency under various outlier percentages, again unlike cellGMM.
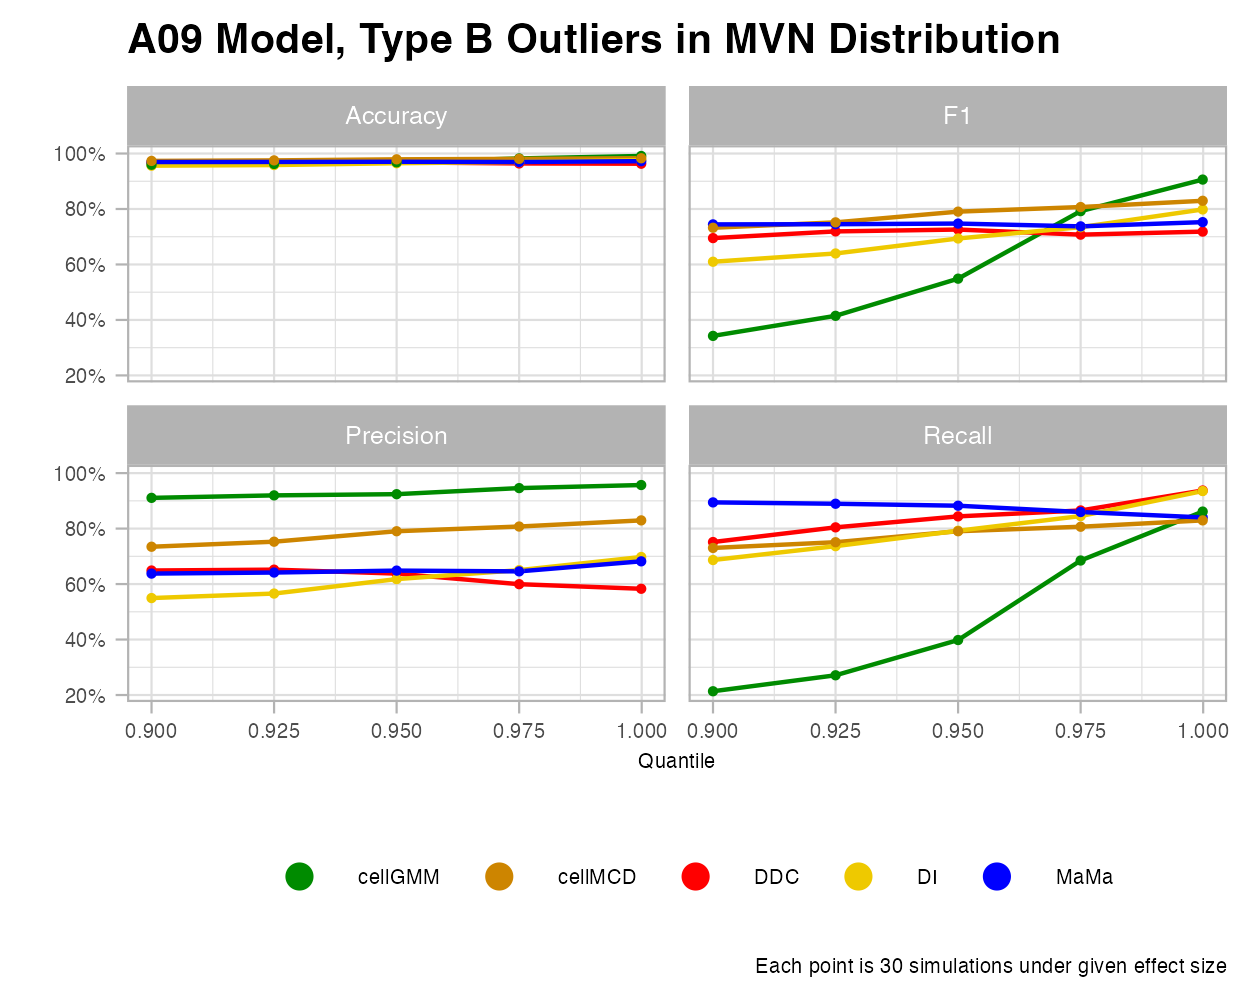
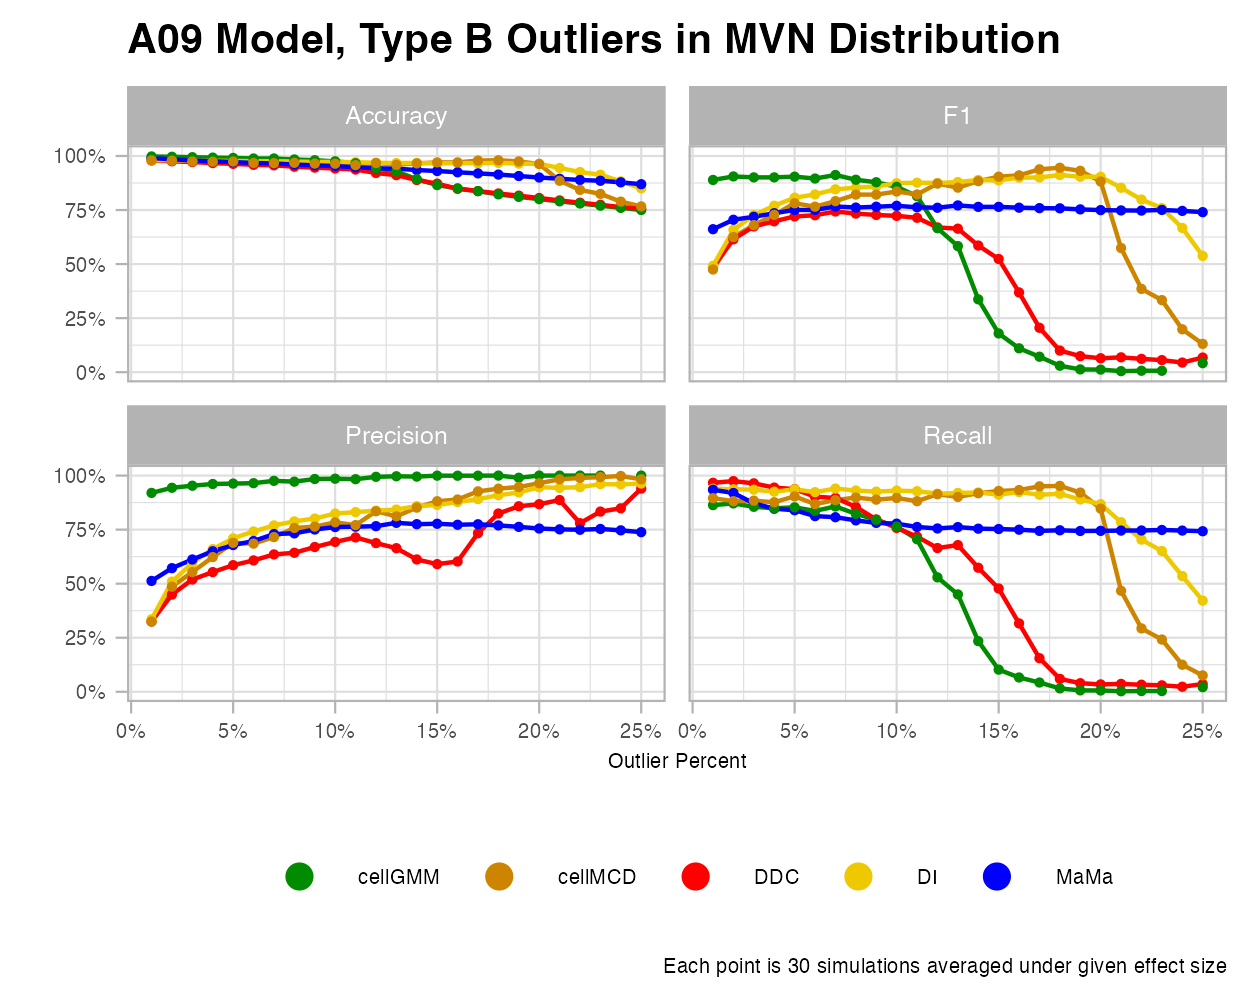
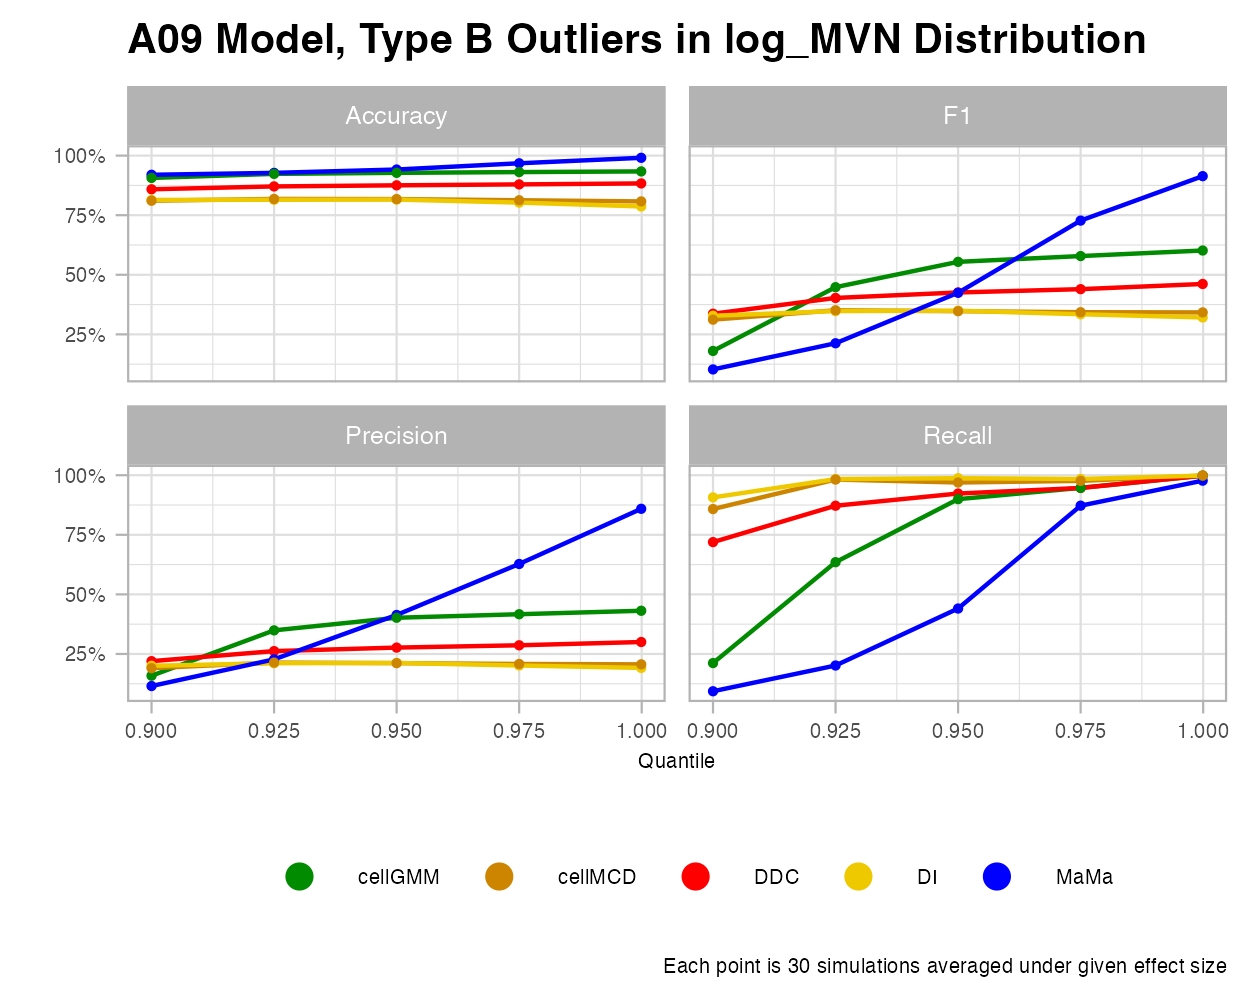
Log MVN
The line chart figures below suggest interesting trends for MaMa. For the quantile increases, MaMa struggles at first, but sharply outperforms the other methods in classifying outliers. For the other four models, there is a certain percentile (around 92.5th to 95th) where we witness no improvement in classification. For the outlier rates, MaMa is clearly performing best in detection up until around 20%, where it takes a sharp decline. The logic behind this trend is unknown as of now, but future research may consider why MaMa had struggled in this area so uniquely.

Type C Outliers
Type C is the simplest case of outliers, where a random percentage of cells within a column are replaced with a set value. This style of outlier creation was designed by Raymaekers and Rousseeuw and the generateData function in the cellWise package. To maintain the designed integrity of this outlier, we only consider the MVN and the bimodal MVN cases, as this function was designed to generate MVN data.
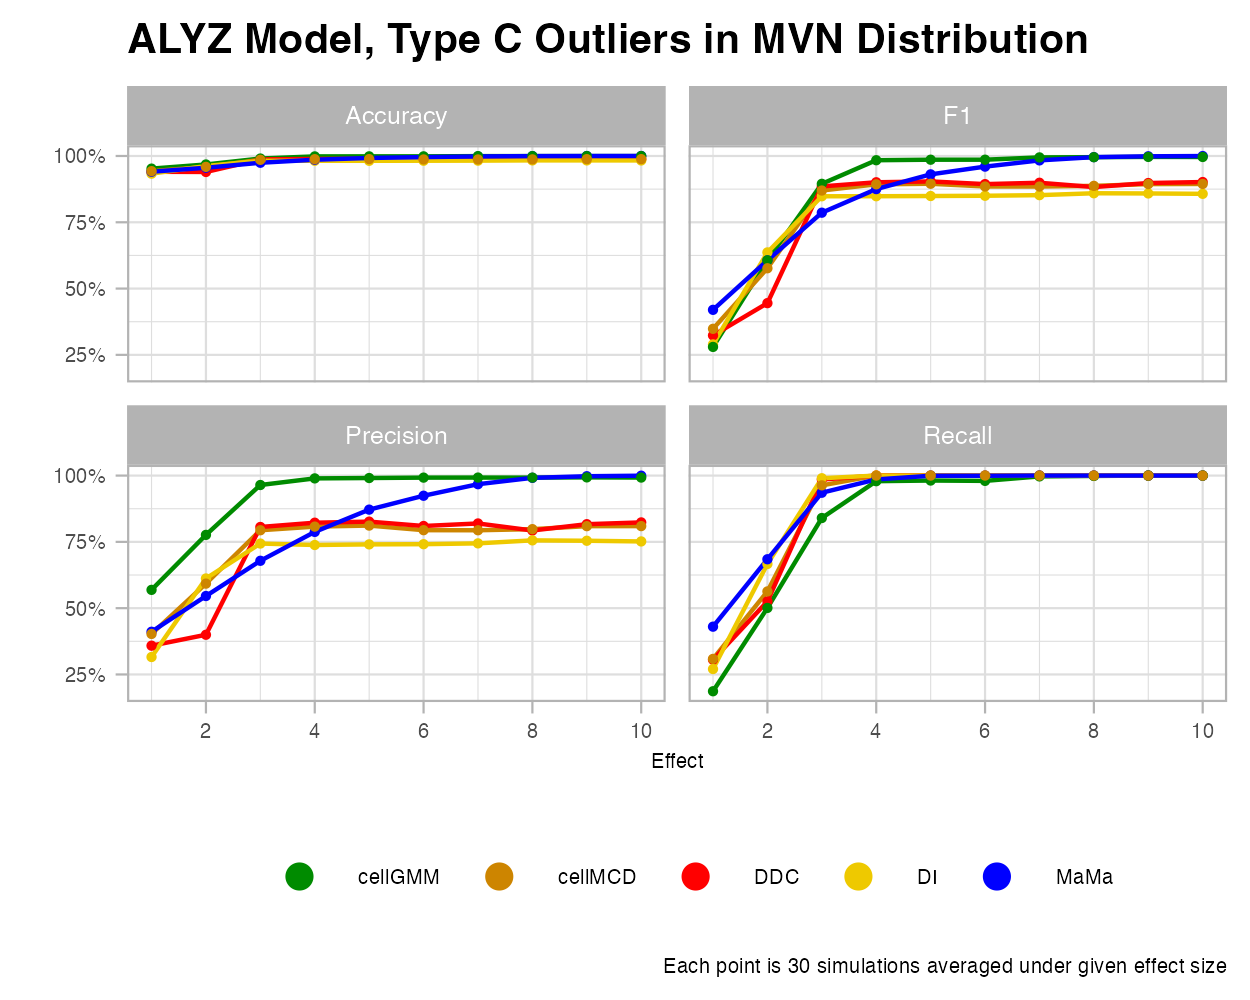
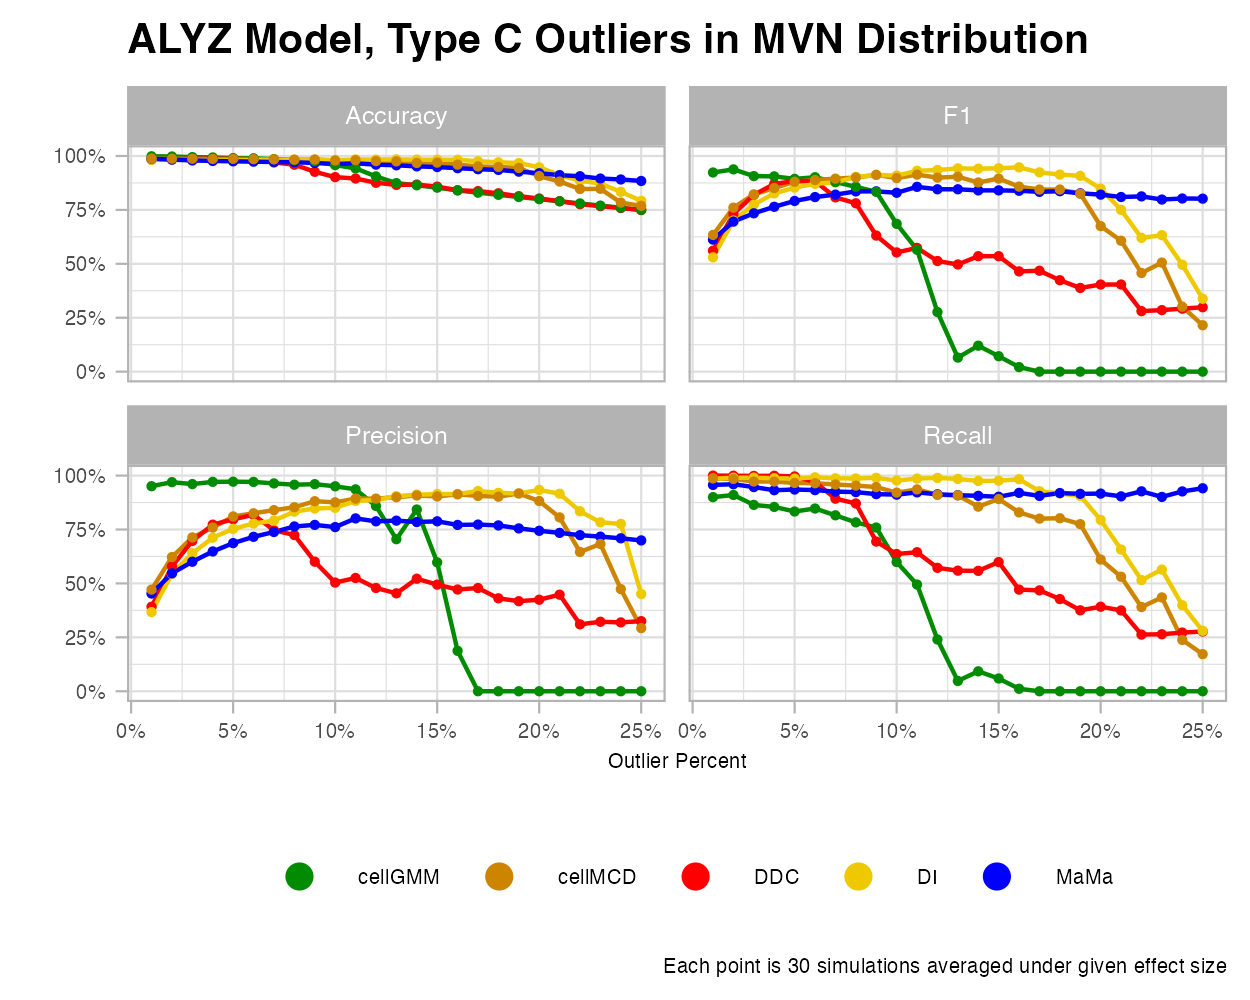
MVN
For the MVN case, it appears that MaMa and cellGMM perform the best under Type C outliers with changing effects. There also appears to be some effect size where DDC, cellMCD, and DI cannot improve further. For growing outlier rates, MaMa again performs the most consistently.
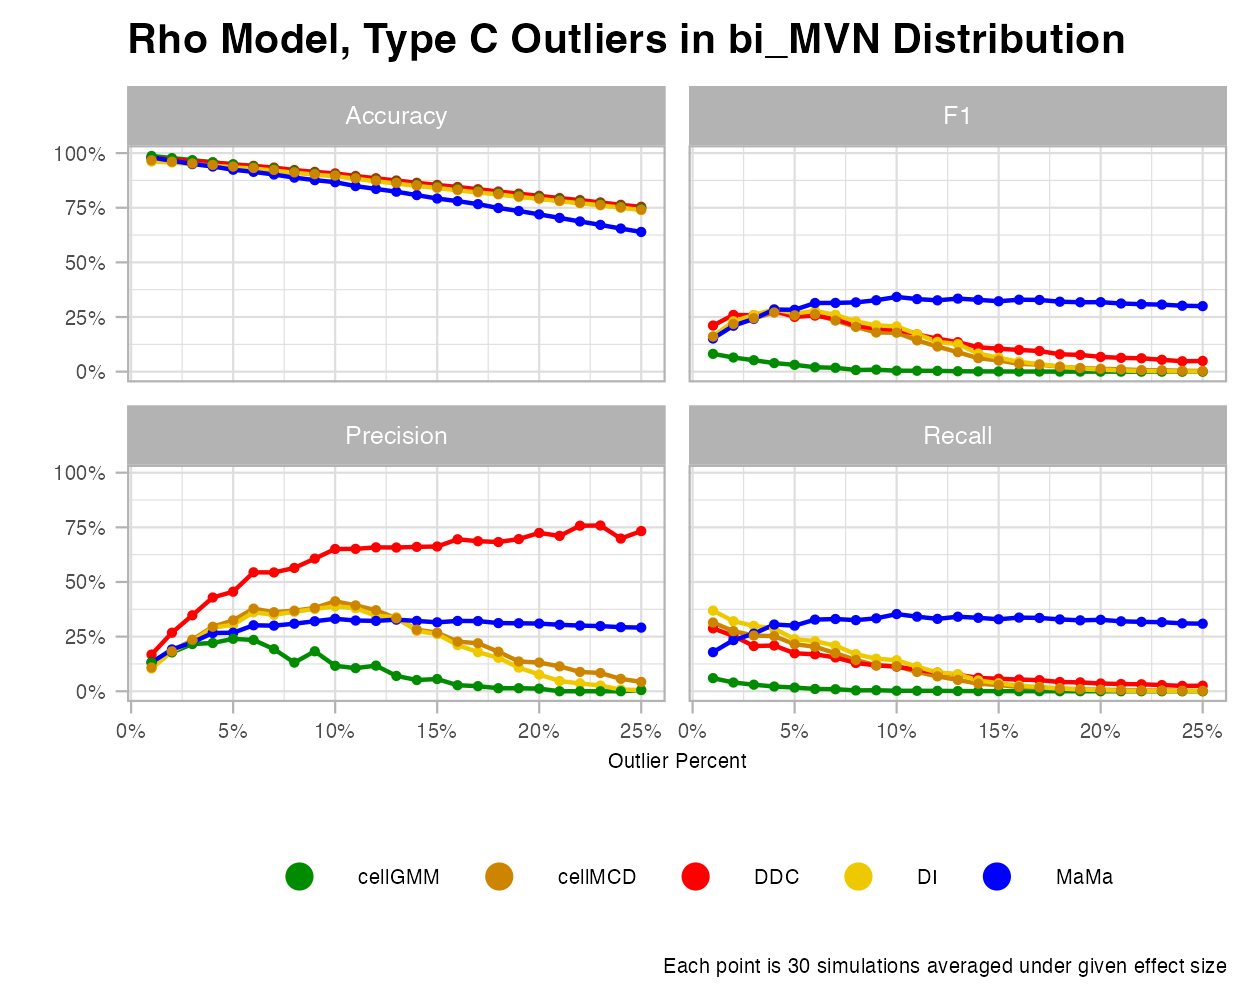
Bimodal MVN
The line charts for this case had very unique trends. We see under growing effect size that each method seems to improve its classification, almost at the same rate. With outlier percentages, however, we see that each method does not perform well at all.

Conclusion
The following post presents that MaMa, while perhaps not the best method across all types of situations, proves very versatile in many of them. This is a critical aspect for those having no prior knowledge about their data, wishing to review potential outliers or typos in the data, and wanting the most efficient way to find them.
This is the first of many simulations that I perform. To see the next simulation style, I recommend reading part 5!
Awards
BYU held their 2025 Student Research Conference where I could to present my research to! I am estatic to share that I was the selected winner of my session (against 6 other student presenters) from the research I describe here.
