Last Updated: 15 Sep 2025
Table of Contents
Introduction
This post goes over more simulation results, but it differentiates from Part 4 in that it dives deeper into how each model performs by reporting explicit metrics. Unlike Part 4, however, we set a static outlier rate and effect size, instead of iteratively grow them. In other words, this post is meant to be much simpler in comparison. We will also evaluate computation times for each algorithm.
Algorithms
A quick recap on how each method functions.
- Detect Deviating Cells (DDC): first standardizes the data using robust estimates of the mean ($\mu$) and covariance matrix ($\Sigma$), then computes robust z-scores based on these estimates, and cells are flagged when their z-score exceeds a critical value from a $\chi_1^2$ distribution.
- Cellwise Minimum Covariance Determinant (cell MCD): estimates the mean and covariance matrix by minimizing the determinant of the covariance matrix over a subset of the data. Then it computes the Mahalanobis distance for each point while iterating through Concentration, Expectation, and Maximization (CEM steps) to refine the estimates of the mean and covariance matrix. This iterative process improves accuracy in identifying outliers, especially in small and noisy datasets.
- Detection Imputation (DI): follows a two-step framework involving detection and imputation. DI first computes robust estimates of the mean and covariance matrix, applies methods like LASSO regression to identify cellwise outliers row-by-row (D-step), then attempts to replace flagged values with best-case predictions based on the current estimates. This process repeats until convergence or until changes in the covariance structure become negligible.
- cellwise Gaussian Mixture Model (cell GMM): Cell GMM works similarly to Cell MCD but introduces a modified C-step to classify which rows belong to which cluster. It estimates the mean and covariance matrix for each cluster, then computes the Mahalanobis distance within each cluster to detect outliers.
- Marginalized Mahalanobis (MaMa): this is the method my professor and I developed. First, it computes $D^2$, which is the Mahalanobis distance of $n$ observations in a dataset. Then it loops through each column $X_1 \dots X_d$ of the dataset, calculating the Mahalanobis distance $D^2{-i}$ of the subset. The marginalized distance stems from $D^2 - D^2{-i}$, which then serves as a $\chi^2$ test statistic, where high statistics suggest greater likelihood of being a cellwise outlier.
Results
In this section, I will present two Monte Carlo simulation study frameworks. One of them reviewed how each method performed when attempting to detect anomalous cells from datasets of various multivariate distributions and outlier types. We prioritize accuracy and F1 score for our comparisons. In the second framework, we combine different volumes of data (rows and columns), along with different outlier rates, overall evaluating and comparing computation times.
By Distribution
The table below reveals the results when attempting to detect outliers from various multivariate distributions and outlier types. Each dataset was 1000x3, with a static 5% outlier rate. Each method was additionally initialized with 5% outlier rate, meaning that each method knew to cutoff their outlier detection based on that value. Finally, each dataset was generated 90 times, 30 times per covariance matrix type.
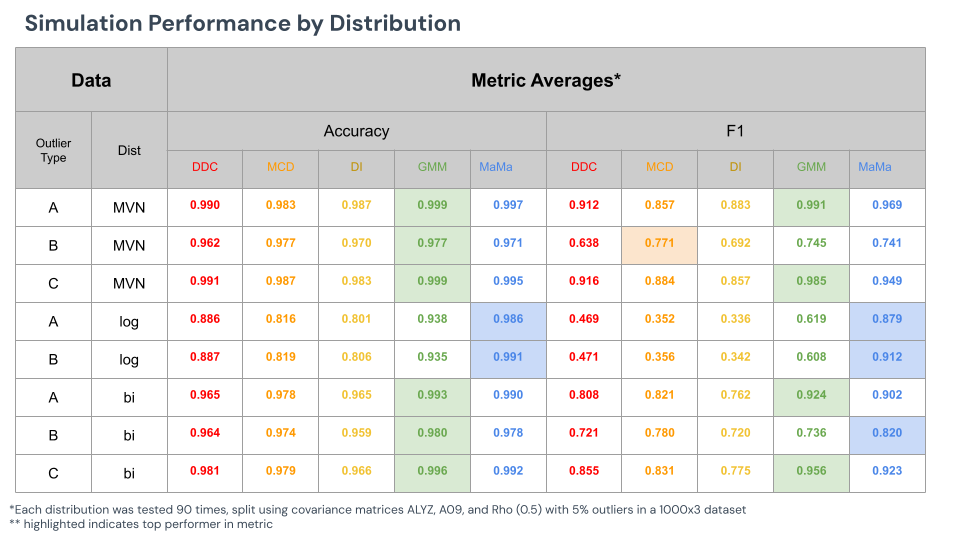
Note that cell GMM appears to be the most accurate and best detector of cellwise methods against most methods. In most cases, however, where cell GMM wins, MaMa is very close second place. And, where MaMa excels, cell GMM barely compares.
We will highlight from this table rows 2, 4, and 8.
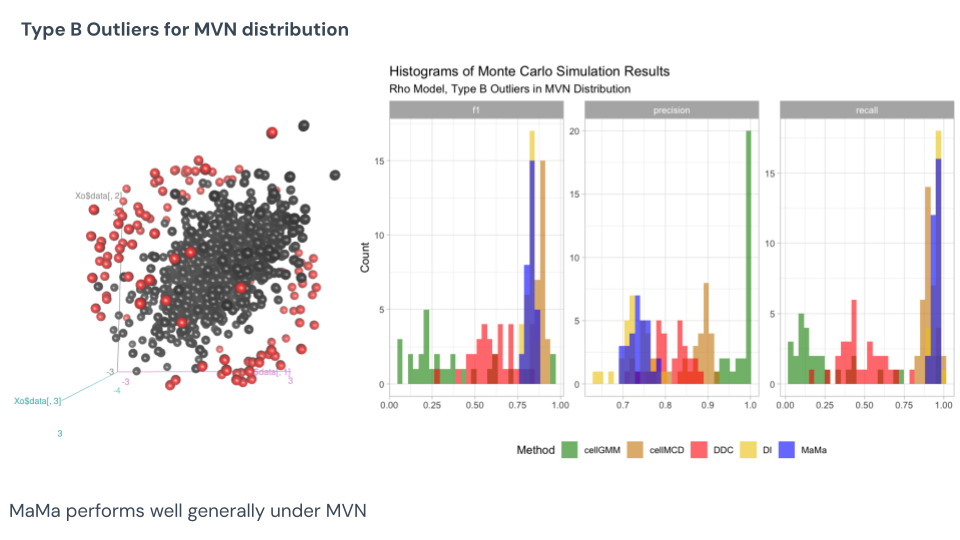
Under this Monte Carlo result of the Type B MVN data, we know that cell MCD won in F1 score and tied for accuracy, but note how consistent MCD is in finding outliers. MaMa is proven the close second pick here when it comes to F1 score, with measuring that same consistency but certainly lower average result. GMM appears very inconsistent, however, aiming for precision versus detection. See that this is the Type B outlier as they are not extreme values, only pulled from their trends. These cells are much harder to detect, and only through evaluating the covariance structures can you find them.
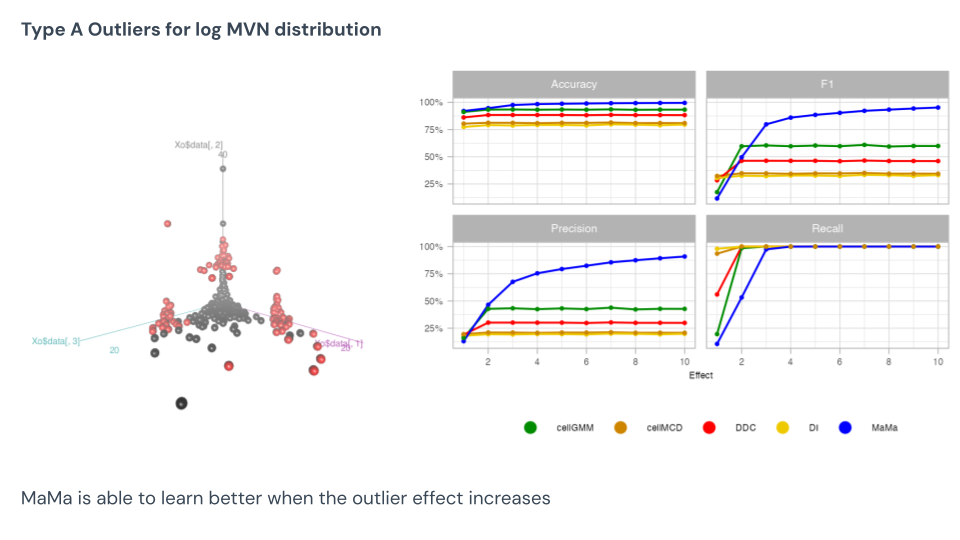
For the Type A log-normal data, here we see MaMa excel. This data has natural skew, and so every point that trends towards that skew will be picked up by the other methods. This is why we see MaMa improve in precision with greater effect sizes, and the other models show no movement. This is an area MaMa does very well in.
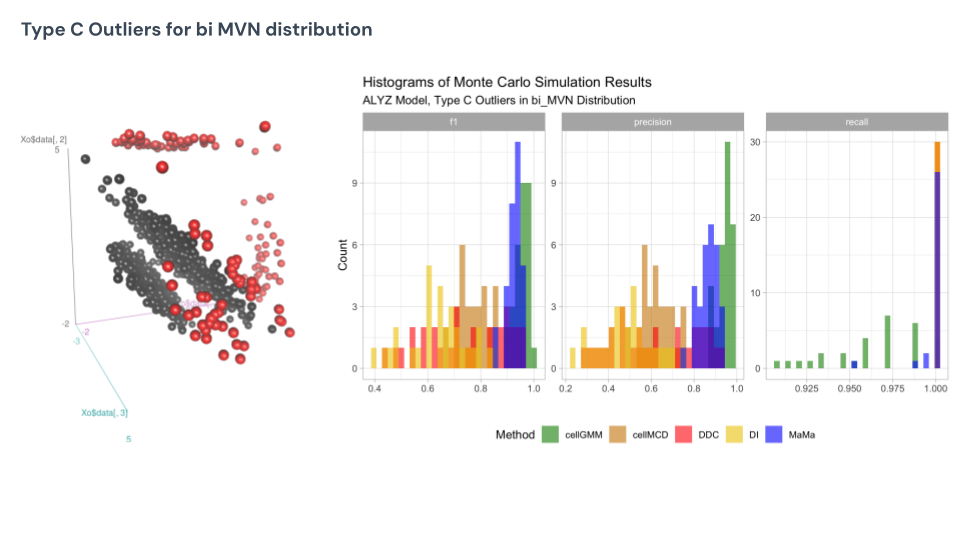
Finally, under the mixture MVN under Type C, we see cell GMM does the best here, appearing to be the most consistent and highly accurate detector for the outliers. This is the type of data GMM was specifically built to do well in compared to their competitors, so it is no surprise here that they come up on top. MaMa is nested below GMM in competition, but boasts the same consistency.
Summary
-
MVN: MaMa is second to GMM when maximizing accuracy and F1 score
-
Log MVN: MaMa performs significantly better than competing methods
-
Mixture MVN: MaMa and GMM perform best overall, with GMM better for extreme values (Type A/C) and MaMa better for deviations from correlation structure (Type B).
By Dataset Size
In the next Monte Carlo framework, we will evaluate computation time (in seconds) based on components such as data volume and outlier rate estimation. No accuracy or F1 score will be reported here: all methods performed relatively similar to each other as this was under the Type A MVN distribution.
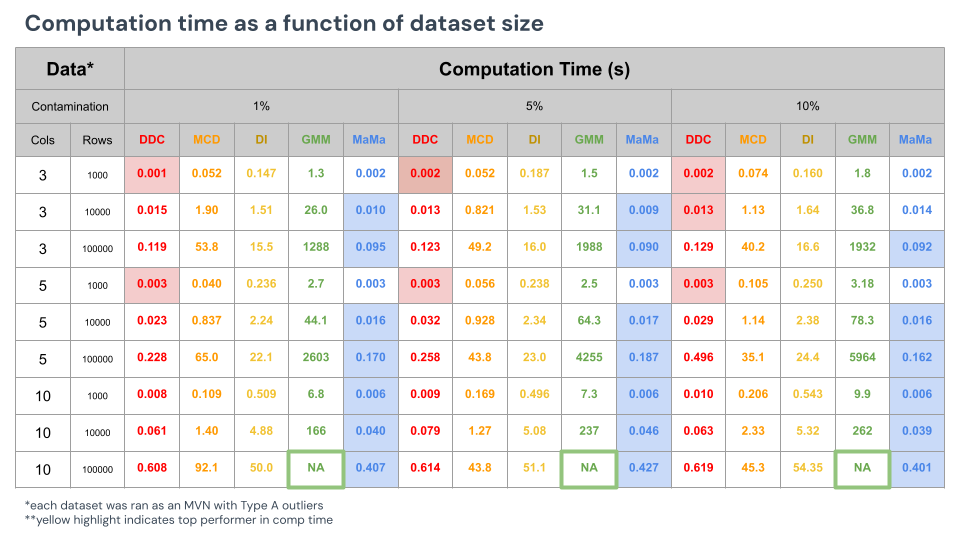
A couple things to note from the results above:
- Higher outlier rates interestingly cause a lot of these algorithms to run longer. Running convergence steps on detection algorithms cause longer periods of runtime as they have to optimize the means and variance of the data quicker. MaMa does not require any convergence in this setting and runs the same regardless of the levels of contamination.
- Fast DDC performs the fastest for smaller data. MaMa runs the fastest for large data.
- Cell GMM is very clearly the slowest. The longest recorded time from GMM was for detecting cells in the 100,000 rows of 5 columns, for 5,964 seconds, or ~100 minutes. Interestingly, any data that was bigger than this would not run, meaning that GMM is such a complex and exhaustive algorithm that it eventually loses RAM and ultimately gives up.
Discussion
Examination of these results suggest that MaMa performs very well under various metrics, but cannot claim to be the best method in every scenario. To summarize the results, I will provide a subjective rating out of 1-5 (5 being best). I will do this based on accuracy, flexibility, speed, and user-friendliness. Accuracy is how well it finds outliers (dependent on F1 score), flexibility is how well it handles uncommon data (like Type B outliers, log-normal distribution, high outlier rates), speed is how fast it runs, and user-friendly is how easy it is to use without knowing much about how the algorithm works and how many parameters are needed.
DDC:
- Accuracy: 4
- Flexibility: 2
- Speed: 5
- User-friendly: 5
DDC is an impressive algorithm for being very accurate and extremely fast. This is the most out-of-the-box friendly, being the tool a data scientist uses if they have zero knowledge regarding the contamination level of their data. However, with that comes with a price: its ability to adapt to various forms of data is not very impressive, and struggles with skewed or bimodal data.
cell MCD:
- Accuracy: 3
- Flexibility: 3
- Speed: 3
- User-friendly: 4
Cell MCD has quality applications in guessing the outliers and imputing them. The method is somewhat flexible to new data compared to its predecessors DI and cell MCD, but definitely struggles compared to algorithms outside the family. It is error-prone when attempting to impute the correct rate of outliers, but it does have an ability to guess the column-wise rate of cellwise outliers somewhat well (more on this in future posts). It's a solid algorithm, good convergence tools, and options for fixing the data.
DI:
- Accuracy: 2
- Flexibility: 1
- Speed: 2
- User-friendly: 4
DI has its main purpose in "detecting" then "imputing" these values, but most of its energy is spent on the latter. It has proven not to be a very computationally efficient algorithm, and does not appear to do well in classifying the outliers. It does work decently well for normal data.
cell GMM:
- Accuracy: 5
- Flexibility: 5
- Speed: 1
- User-friendly: 1
Cell GMM is a very exhaustive and complex model, being able to accurately detect the outliers in many forms of data. It especially excels at bimodal data: addressing a weakness within R's cellWise package family. However, this model is extremely finnicky: with 10 tuning parameters and not a very developed help file nor instruction on its usage, data scientists attempting to use this to clean their data will have a very hard time using it. It is also very time consuming. If the data spans larger than one million cells, it will give up after >80 minutes of processing. In fact, my university's servers could not handle the GPUs and memory required to run this. All in all, if you take the time to understand the inputs, and want to clean a very small dataset, then a data scientist can find success in cell GMM's applications.
MaMa:
- Accuracy: 4
- Flexibility: 5
- Speed: 4
- User-friendly: 4
MaMa has a lot of strengths in its ability to be an accurate predictor, flexible across multiple types of data, have relatively high computation speed for large datasets, and serving as a very easy tool for data scientists wishing to clean their data. In most of our simulation studies, MaMa has proven itself to be at least "second best" at almost all testable scenarios, and where it is not second best, it is very close to the top performing leaders. The main weakness of MaMa, as hinted already, is finding the outlier rate estimation. However, none of the other tested algorithms have a solid answer for guessing this rate. Some of them require extensive parameterization like GMM, others use a form of convergence (EM steps), that attempt to converge to a rate but don't always accurately estimate the truth (more on this in future blog posts).
Conclusion
To summarise, Marginalized Mahalanobis has proven to be a very formidable framework to detect and identify cellwise outliers. It aligns detection-wise under normal data to leading methods, and proven itself to be superior when detecting outliers in skewed and bimodal data. Additionally, its computation speed, along with the user-adaptability, is an attractive option for data scientists wanting to clean their data quickly.
Next steps for this project include:
- Developing my first R package for importing MaMa
- Using statistical theory to detect the presence of cellwise outliers
- Working on my master’s project!
Awards, Conferences, and Appreciation
I had the privilege to present this research to an audience of statisticians in Nashville, TN for the 2025 Joint Statistical Meeting. I was grateful for presenting for 15 minutes to this audience, as well as hold a few conversations with working professionals about my work afterwards.


In addition, I was recognized by my department chair starting off this semester as the top contributor in the department. This was due to providing a mixture of lots of research, networking efforts, and developing commraderie within the cohort!

I am grateful for the BYU Statistics Department for the sponsoring me in my trip to JSM, funding the research developed within this project, and creating the environment for me to learn, grow, and achieve amazing accomplishments within my statistics career!