Last Updated: 06 Jan 2026
Table of Contents
Acknowledgements
This project was not worked on alone. I am very grateful for the expertise and dedication from Ty Hawkes and Grant Nielson and their contributions to this work.
Abstract
This project investigates the factors influencing lap times in Mario Kart 8 Deluxe using multivariate statistical methods. Through a controlled experiment with 14 participants racing on four courses at varying speeds, we analyzed the effects of speed (CC), course, player skill, and kart attributes on lap performance. MANOVA, canonical discriminant analysis, clustering, PCA, and multivariate regression revealed that higher speeds increase variability, course characteristics affect lap-to-lap performance, and distinct skill groups exist among players. Additionally, kart attributes significantly impact lap times, with higher acceleration, handling, and mini-turbo favoring later laps.
Introduction
Mario Kart, first released in 1992, has become one of the most popular racing games worldwide. The game features various characters, karts, and tracks, each with unique attributes that affect the game-play. Despite its underlying complexity, the goal is simple: Finish the fastest. This project aims to analyze the factors that influence lap times in Mario Kart 8 Deluxe using multivariate statistical techniques. Specifically, we want to know how much the kart attributes affect performance, whether the learning curves differ between courses and speeds, and if there are distinct skill groups among players after accounting for other factors. By applying methods such as MANOVA, canonical discriminant analysis, PCA, multivariate regression, and clustering, we hope to uncover the intricate relationships between these factors and their impact on each lap. Our analysis will provide insight into the dynamics of Mario Kart 8 Deluxe and inform strategies for optimizing lap times at various skill levels
Methodology
To be able to answer our research questions, we conducted a randomized experiment to collect performance data from various BYU Masters students playing Mario Kart 8 Deluxe.
Experimental Design
The experimental design had the 14 BYU masters students race on the same 4 tracks in Mario Kart 8 Deluxe, under controlled conditions. Time trials were used to eliminate the influence of other players and items, focusing solely on individual performance. Players were not allowed to use in-game items to ensure that performance was only influenced by player skill and kart attributes. Players were also not allowed to restart or retry on any race. Each player raced two courses at 150cc and two courses at 200cc, with the order of courses randomized. Players were not allowed to practice on the courses beforehand, however, they were given a brief overview of the game mechanics to ensure familiarity. Players were randomly assigned different kart attributes by selecting random combinations of characters, kart bodies, tires, and gliders. Their only goal was to finish the race as fast as possible.
Courses
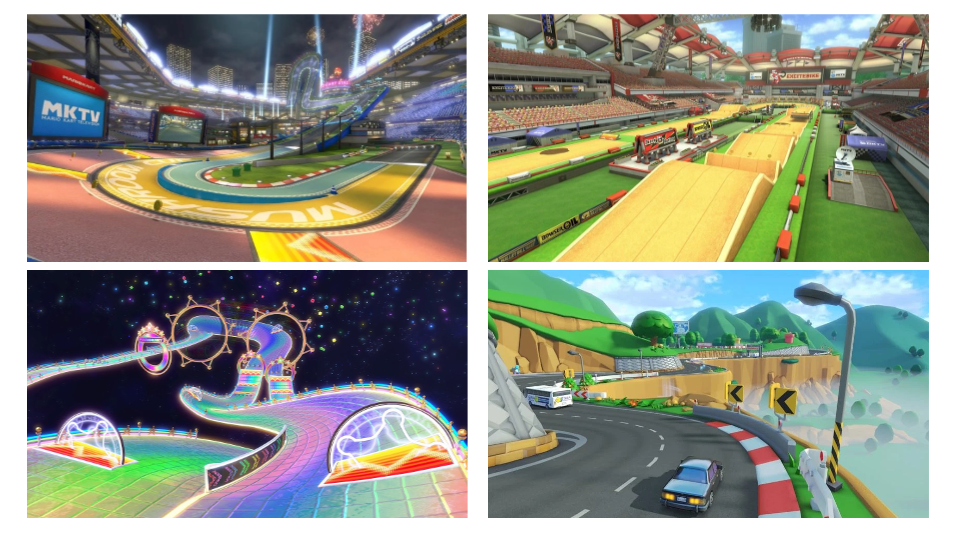
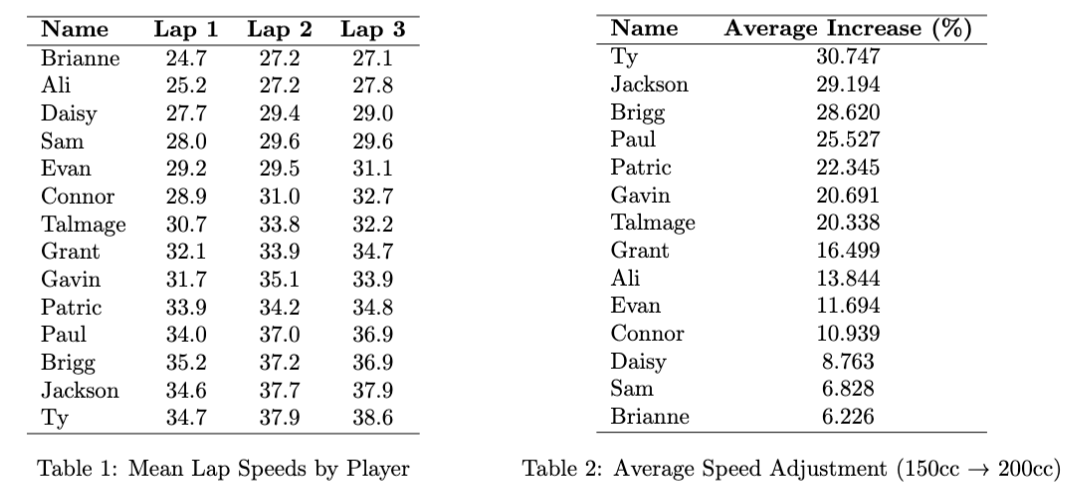
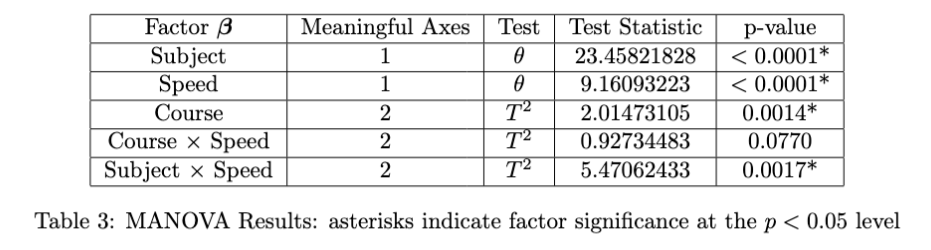
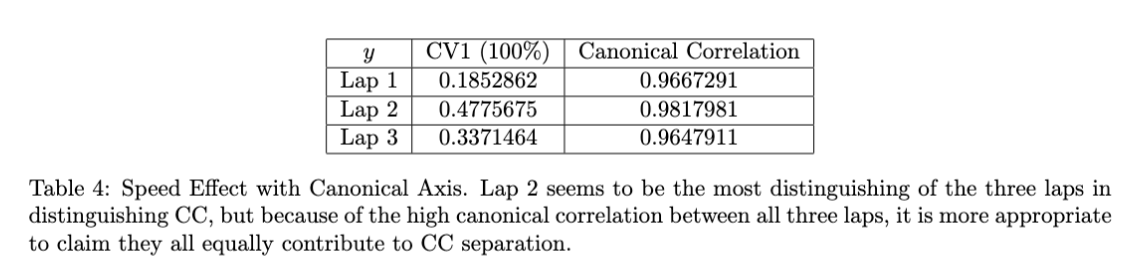
Four different courses were used in this experiment, each with varying characteristics and difficulties. Course 1 was Mario Kart Stadium, a beginner-friendly track with minimal obstacles and turns. Course 2 was Excitebike Arena, featuring a significant number of jumps and a simple layout. Course 3 was Rainbow Road Wii, known for its challenging turns and lack of guard rails. Finally, Course 4 was Shroom Ridge, a track that takes place on a busy highway, creating several unpredictable obstacles.
Kart Attributes
Each player was randomly assigned a character, kart body, tires, and a glider, generating different combinations of kart attributes. The attributes considered were speed, acceleration, weight, handling, traction, and mini-turbo duration. Mario Kart 8 Deluxe’s displayed stats for speed and handling are not the actual in-game values, but rather an “average” of the hidden, more complex stats. Speed and handling vary depending on the surface that the player is racing on. For this experiment, we generated an average for these two attributes based on the hidden values weighted by the frequency of each surface type on the selected courses. This was done to better represent the actual in-game performance of the karts and remove unnecessary complexity from the analysis.
CC Speed
Each player was randomly assigned to race two courses at 150cc and two courses at 200cc. The CC speed affects the overall speed of every racer’s kart, with higher CC speeds resulting in faster gameplay. 150cc is considered the standard speed for casual competitive play, while 200cc is the fastest and most challenging speed available in the game.
Data Collection
Data collection was performed before and after each race. Prior to each race, we recorded the kart attributes for each player based on their randomly assigned character, kart body, tires, and glider. We also noted the course, CC speed, and order of each race. At the end of each race, we recorded the lap times in seconds for all three laps of the race as displayed in the game.
Statistical Models
MANOVA
Multivariate Analysis of Variance (MANOVA) will be the main tool for determining the effects of speed (CC), course, and subject across the three lap speeds. MANOVA formulas center around comparing Hypothesis ($H$) and Error ($E$) matrices, which isolate grouping effects in multivariate space. The $H$ and $E$ matrices are key components that help in creating discriminant axes, which compute the loadings from the response vector $y$ onto the factor variables $X$. Observations can then be plotted onto discriminant space by calculating: \(\boldsymbol{Z} = \boldsymbol{X} \boldsymbol{\text{eig}(E^{-1}H)},\)
where $X$ is the identity matrix with the experimented variables and $\text{eig}(E^{-1}H)$ is the eigen decomposition from using a specific $H$ matrix (between-group variation for the factor being tested). $\boldsymbol{Z}$ was then standardized to aid in interpretability, as followed in my Strong Youth Project.
We note that the original intention was to utilize a random effects and repeated measures MANOVA for this analysis, which was meant to isolate the influence of subject-by-subject skils, but due to some discovered limitations within the SAS language, subject could not be included as a random effect. Despite this setback, a subject fixed-effect ended up providing unique and novel ideas to our research.
Multivariate Multiple Regression
Multivariate Multiple Regression (MMR) is an extension of multiple regression analysis that allows for the simultaneous prediction of multiple dependent variables using one or more independent variables. In MMR, we model the relationship between lap speeds and multiple response variables, capturing the interdependencies among the responses. The general form of the MMR model can be expressed by the following equation:
\[\mathbf{Y} = \mathbf{X}\boldsymbol{\beta} + \boldsymbol{\Xi}\]To aid interpretation, we compute standardized canonical coefficients that indicate how our kart attributes affect lap speed.
Ward Clustering
In order to determine which racers are most similar, we used Ward clustering. Ward clustering uses Euclidean distances to find the amount of between-group variance from the players’ standardized race results, and then groups the players with the least amount of differences in variance. K-means clustering was tested as well, but the results were nearly the exact same. This is due to a small dataset and strong natural groupings. Either method would have worked fine, since clustering was just used for inference and grouping rather than predicting. Ward’s method was selected.
Results
Tables 1 and 2 feature the data of each subject and their lap speed. Lap Speeds were calculated by dividing the track distance by the lap time. Distance was calculated by driving each course on 50cc in the center of the track, and using the estimated 10 meters/second kart speed to convert lap times to meters. These speeds were multiplied by 22.3 to approximate the average miles per hour of each lap. across courses and cc settings. Note how subjects had relatively consistent lap speeds, with the speed rising across all subjects from lap 1 to lap 2 to lap 3. This was a notable pattern found most subjects. Additionally, the average speed increase from raising the cc setting from 150 to 200 differed across subjects. These two themes are consistently present throughout our multivariate analysis.
How do speed (CC), course (map), and subject skill affect lap speeds?
Our multivariate analysis results stem from testing the effects of our main experimental factors relative to each of the three laps. In this setting, we aim to determine under the MANOVA the following:
- if increasing race CC alters the multivariate pattern of lap speeds.
- if the four courses differ in how speeds evolve across laps.
- if subjects respond differently across CC settings and courses.
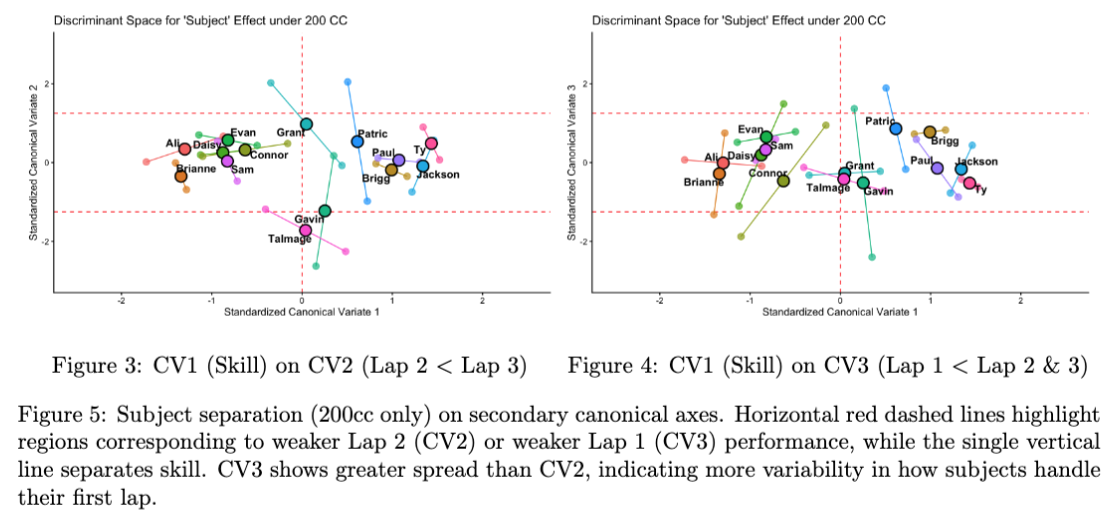
Table 3 condenses the MANOVA results outputted from SAS. The subject effect is treated as fixed in this setting because it explains a substantial portion of variability in lap performance (as evidenced by a highly significant multivariate statistic with 13 degrees of freedom). After accounting for subject-level skill differences, both speed and course remain significant. As expected, average speeds are higher at 200cc than 150cc, though we also find increased variability in 200cc performances, a point explored in later sections. Course differences were also statistically meaningful: maps such as Mario Kart Stadium (MKS) and ExciteBike Arena (EBA) produced faster lap speeds than Rainbow Road Wii (RRW) and Shroom Ridge (SR), though the sources of these differences are course-specific. We discuss the subject $\times$ speed interaction in detail in the final subsection.
Across factors, the three lap speeds are highly correlated. Thus, many effects are well-captured by a single discriminant axis, often explaining 80% of the variance in lap speed patterns. When two axes are present, subtle lap-specific differences become important—especially for the course and subject effects.
Speed (CC)
Even though the speed effect interacts with subject skill ($p=0.0017$), it is strongly significant overall ($p<0.0001$). Table 4 shows that the single discriminant variate (CV1) loads heavily on all three laps, with particularly strong contribution from Lap 2. Canonical correlations above 0.96 indicate that the multivariate speed profile shifts consistently across laps.
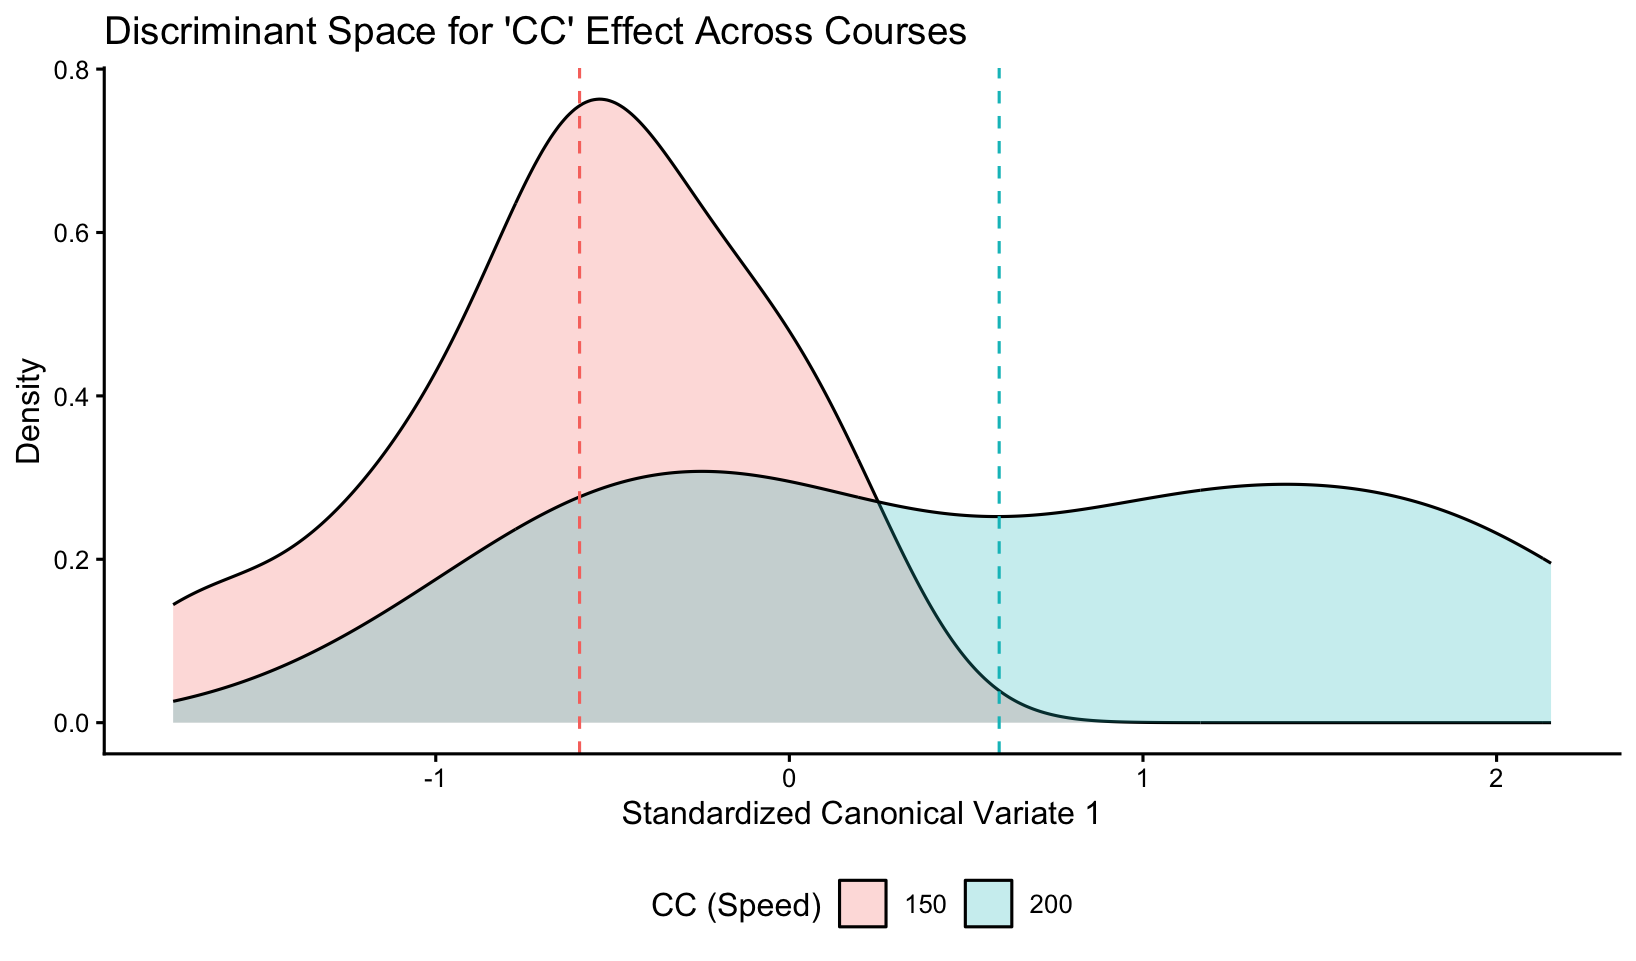
One possible explanation for the Lap 2 dominance is that some subjects require a lap to adjust to 200cc, especially on volatile courses such as RRW, leading to large improvements (or large mistakes) specifically in Lap 2. Others remain stable across laps. Figure 1 illustrates these findings. The 200cc group not only shows higher mean CV1 values, but also a noticeably broader distribution, reflecting the wide range of subject adaptability at high speed.
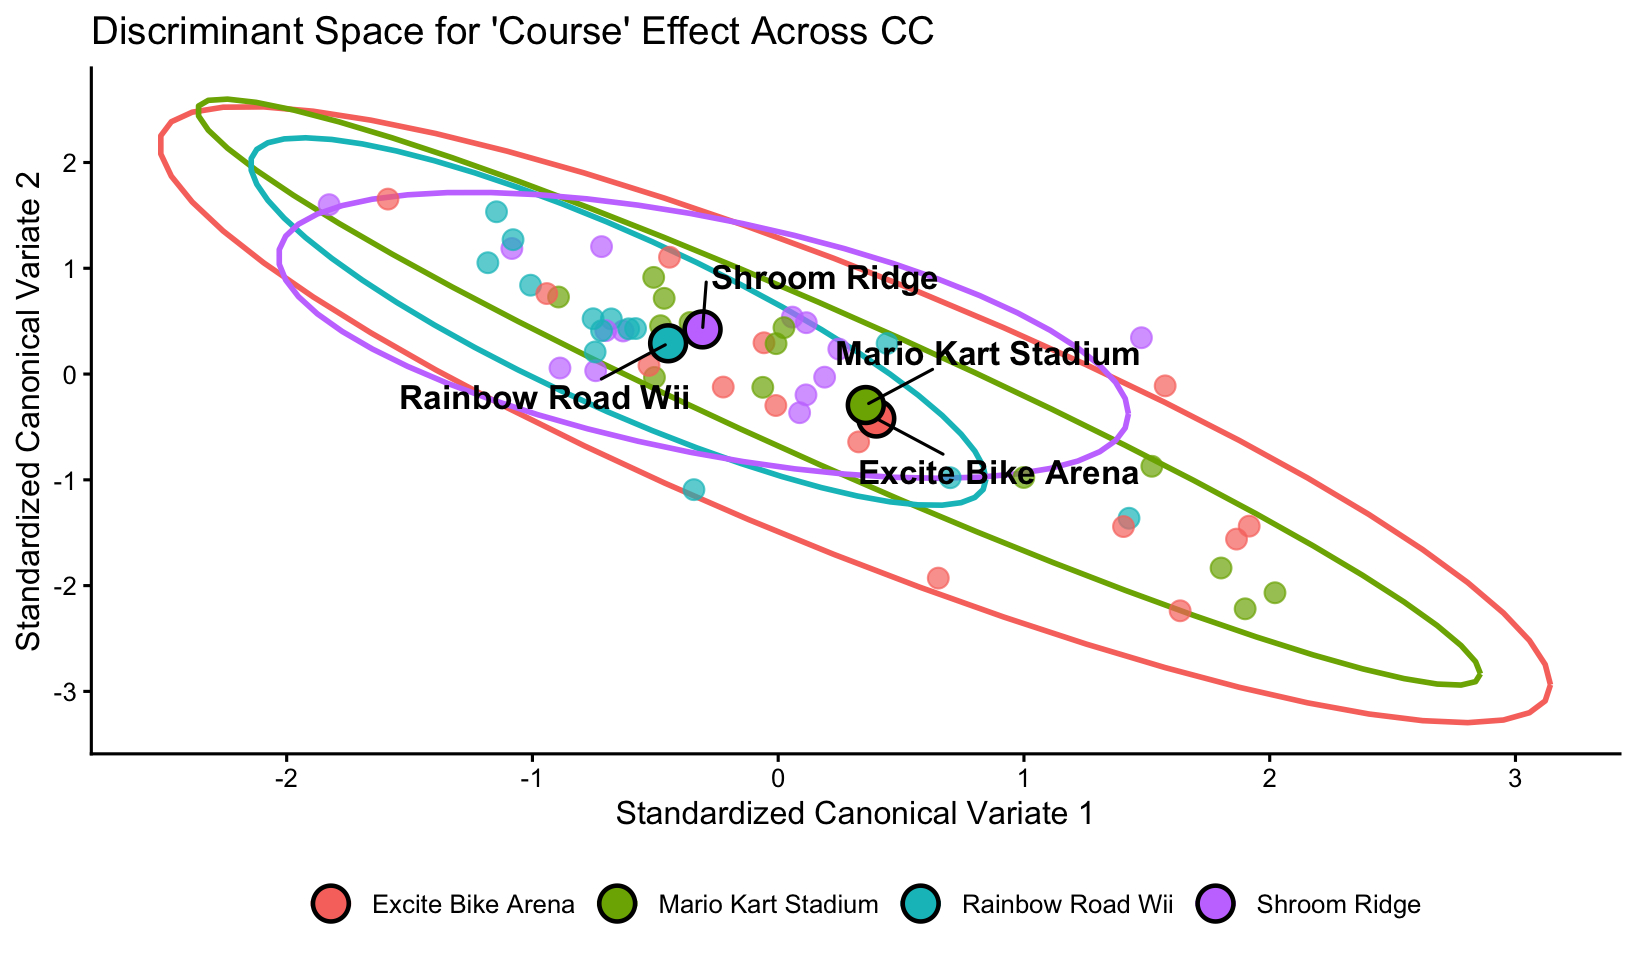
Course
The course effect reveals meaningful structure in how subjects progress across laps. Because raw speed is used instead of time, the analysis accounts (to the extent possible) for course length while still reflecting course-specific difficulty.
From Table 5, two meaningful axes stood out in the discriminant analysis. We note that:
-
CV1 (80% of variance) contrasts Lap 1 and Lap 2 performance against Lap 3. Higher CV1 values correspond to faster early laps; this is where MKS and EBA cluster in Figure 2, consistent with their lower difficulty and shorter learning curves.
-
CV2 (18% of variance) highlights Lap 2 versus Lap 3 behavior. Difficult courses such as RRW and SR tend to show substantial improvement from Lap 1 to Lap 2, but little or negative improvement from Lap 2 to Lap 3. This results in their separation along the vertical (CV2) direction.
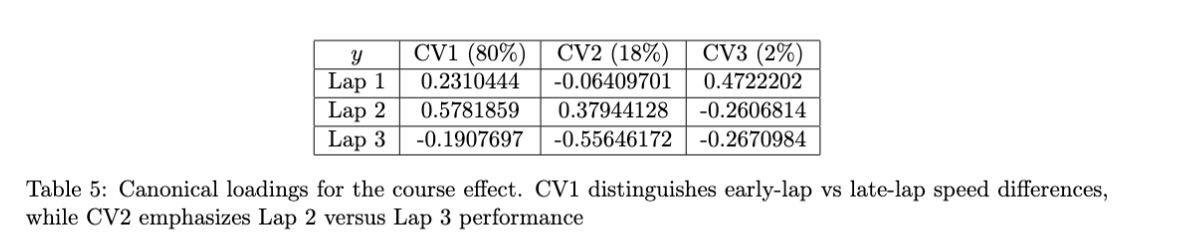
Overall, the course effect captures meaningful lap-specific dynamics, with MKS and EBA showing greater consistency and narrower spread, and RRW and SR exhibiting larger lap-to-lap shifts.
Subjects
Subject effects contain some of the richest structure in the multivariate analysis, even though subjects are not traditionally treated as fixed effects in ANOVA. As shown in Table 6, CV1 alone explains 96% of the subject variation, with all three laps contributing positively. This is clearly indexing overall skill. CV2 and CV3 (each about 2%) capture subtler differences in how subjects progress across laps.
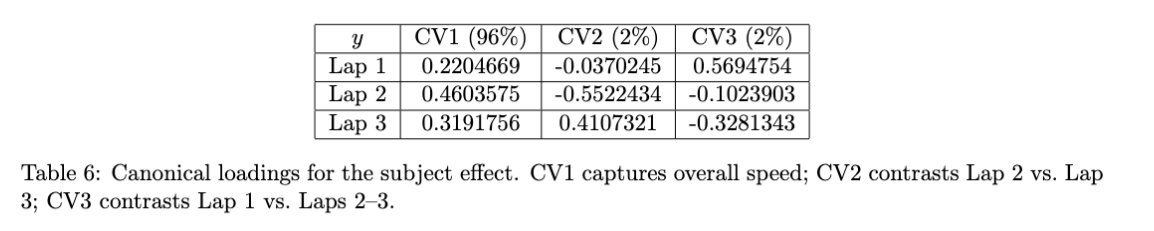
Figure 5 displays the subject effect restricted to 200cc, where between-subject skill differences are most pronounced compared to 150cc (and is evident by the significant subject $\times$ speed interaction). High CV1 values identify the strongest racers (e.g., Jackson 🏆, Ty, Brigg, Paul), who also show stable lap profiles (CV2, CV3 near zero). Low CV1 values identify the weaker racers (e.g. Ali, Brianne), who show consistent under-performance relative to the rest of the sample. Mid-tier racers show moderate CV1 but more variation in CV2 and CV3, indicating inconsistent laps. For example, Patric exhibited strong Lap 1 and Lap 3 speeds but an unusually slow Lap 2 on MKS, which is placing him high on CV2 for one of his observations. Conversely, Gavin had a very poor Lap 3 on SR, placing him extremely low on both CV2 and CV3.
Are there distinct skill groups among players?
Clustering, following the procedure outlined in the methods section, produced groupings that largely support the conclusions from the MANOVA. An elbow plot had shown that a clear reduction in within-cluster sum of squares recommends three to four, after which the marginal improvement begins to plateau. Although a three-cluster solution is defensible, we ultimately selected four clusters because it provides a more meaningful separation of player skill levels. Under a three-cluster configuration, the elite group became disproportionately large (over half the field) which did not align with observed performance differences.
Most of the separation across clusters occurs along the x-axis, which appears to correspond to overall speed or general skill level. Ranking players by their mean speed across all tracks produces an ordering that is consistent with the cluster assignments, with only minor disagreements (see bottom figure and Table 1).
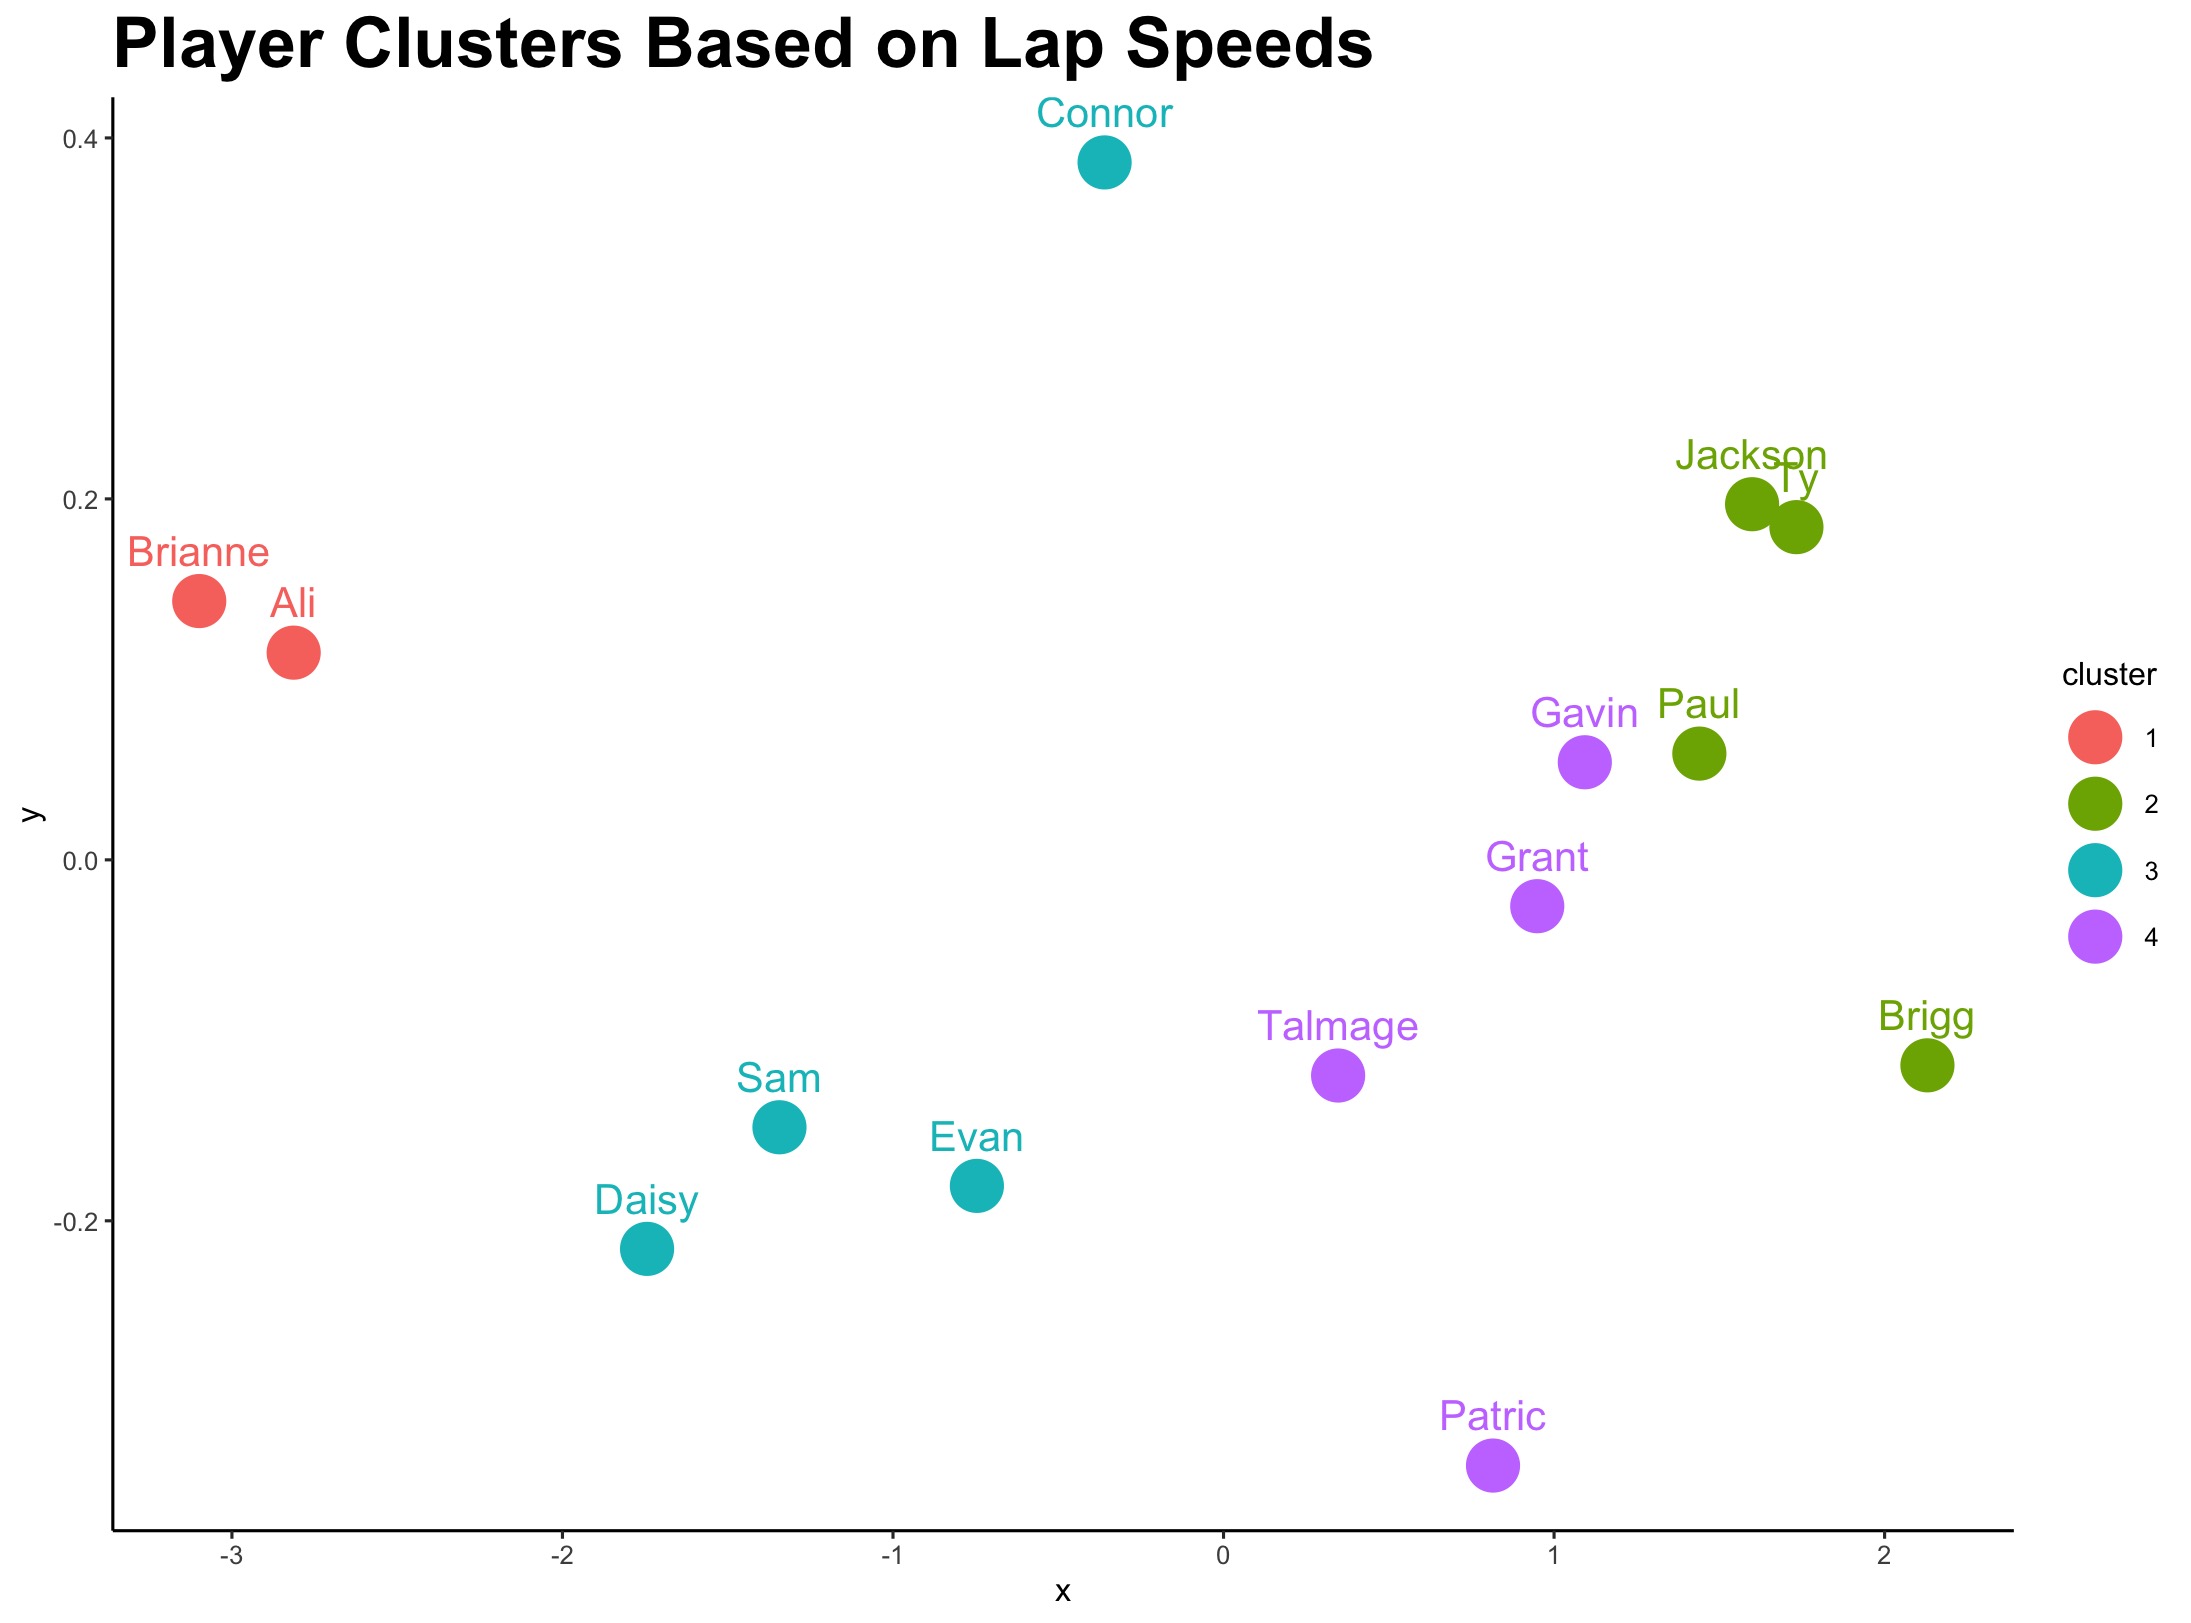
The y-axis reflects consistency in lap speeds. Players with lower values, such as Patric, exhibit relatively stable lap times, whereas players with higher values, such as Connor, tend to display larger variability across laps. This secondary dimension helps refine the cluster structure by distinguishing players who may be similarly fast on average but differ in their reliability.
Combining evidence from MANOVA and Ward’s hierarchical clustering, four qualitatively distinct skill groups emerge: an elite group of highly experienced players (Jackson, Ty, Paul, and Brigg); a good group familiar with the game but less dominant (Patric, Gavin, Grant, and Talmage); an average group that likely has broader video game experience but less Mario Kart–specific expertise (Connor, Evan, Sam, and Daisy); and a poor group consisting of Ali and Brianne. These clusters are visually apparent in Figure 7. The canonical axes from the MANOVA reinforce this separation, with one notable exception: Patric appears closer to the elite group on the canonical plot than in the clustering solution. This discrepancy may be attributable to his unusually low lap-time variance, which influences the MANOVA space more heavily than the distance metric used in clustering.
How much do kart attributes affect performance?
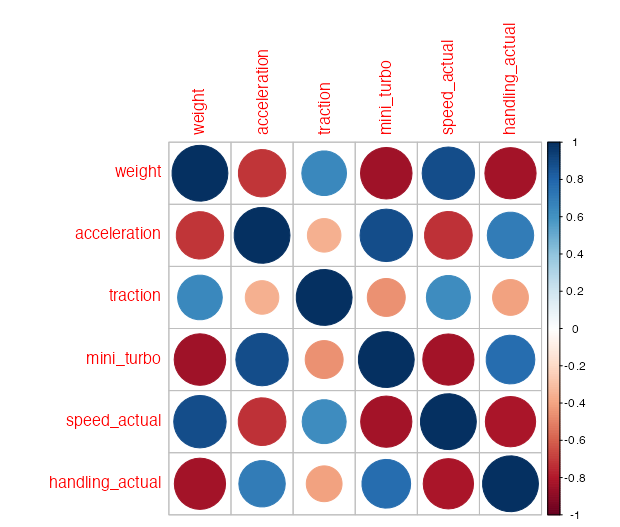
As expected, the kart attributes exhibit substantial correlation structure. To reduce dimensionality and identify the major underlying dimensions driving performance, we conducted a Principal Component Analysis (PCA) on the six kart attributes. The first principal component (PC1) explained approximately 76% of the total variance—indicating that most of the information in the attribute set can be summarized along a single dominant axis. Table 7 presents the loadings and the proportion of variance explained for the first three components.
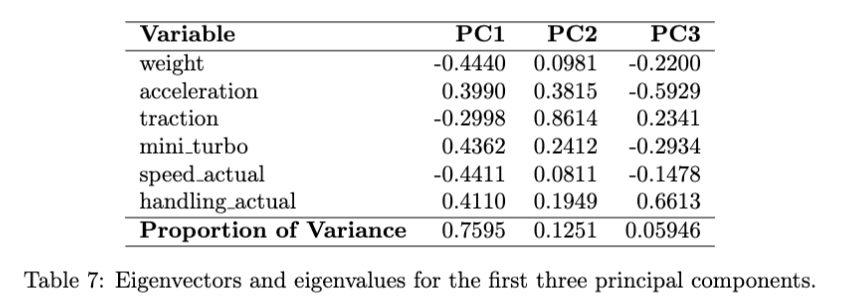
PC1 captures a clear contrast between two sets of attributes. Higher PC1 values correspond to karts with greater acceleration, mini-turbo duration, and handling, while lower PC1 values correspond to heavier, faster, and more traction-oriented karts. This dominant axis of variation therefore describes a trade–off between agility versus raw speed and stability.
To examine how these characteristics relate to lap performance, we performed a Multivariate Multiple Regression (MMR) using PC1 as the predictor in addition to CC speed, course, and subject. Our response variables remain the same as the MANOVA: the three lap speeds. An overall multivariate test using Pillai’s Trace indicates that PC1 significantly predicts lap performance ($V$ = 0.38, p = 0.013).
Thus, the collective pattern of kart attributes—summarized by PC1—has a statistically significant effect on performance. To interpret these effects across laps, we examined the standardized canonical coefficients for the first canonical variate (Can1), shown in Table 9.
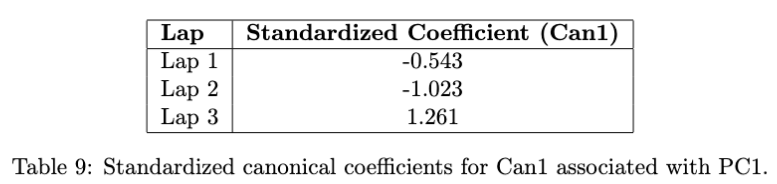
These coefficients suggest a nuanced relationship between kart attributes. Higher PC1 values (karts emphasizing acceleration, mini-turbo, and handling) are associated with slower Lap 1 and Lap 2 speeds, but faster Lap 3 speeds. Lower PC1 values (heavier, faster karts with higher traction) yield the opposite pattern: faster early laps but slower Lap 3 performance.
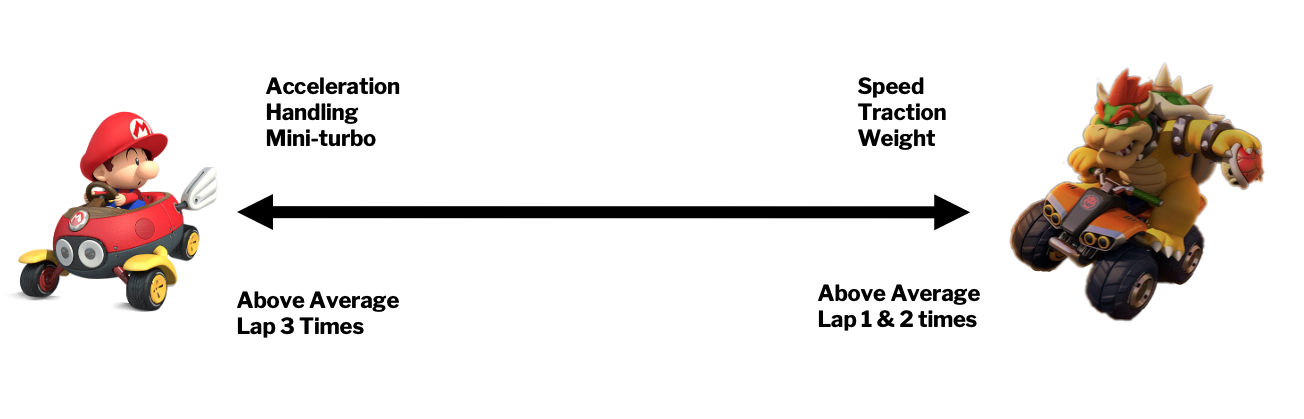
Because lap speeds generally increase from Lap 1 to Lap 3 as players become more familiar with the course, these results imply that agility-oriented karts may better reward adaptation over the course of a race. Their enhanced handling and acceleration may become more advantageous once players have stabilized their driving lines. In contrast, karts that rely on raw speed and traction may provide strong early-lap performance but offer fewer gains once the player has reached their comfort level.
Overall, kart attributes matter: although player skill dominates performance variation, the structure of kart characteristics — particularly the agility–speed tradeoff captured by PC1—exerts a measurable influence on lap outcomes.
Conclusion
The goals of this project were to (1) evaluate how speed, course, and subject affect lap performance; (2) determine whether distinct skill groups exist within the cohort; and (3) assess the extent to which kart attributes influence lap outcomes. Across a suite of multivariate methods, each of these questions was addressed with consistent and interpretable findings.
First, MANOVA and the canonical analyses showed that race speed (150cc vs. 200cc) played a meaningful role in performance. The 200cc condition produced substantially greater variability in lap speeds, reflecting the increased difficulty of handling turns and reacting quickly at higher velocities. Course effects were also evident: Mario Kart Stadium and Excitebike Arena generated the most stable lap times, while Rainbow Road Wii and Shroom Ridge exhibited a pronounced “learning curve,” with many players improving by lap three. These latter courses also produced greater lap-to-lap variance, indicating that their technical layouts amplified individual differences in adaptation and consistency.
Second, Ward’s hierarchical clustering revealed four distinct skill groups—Elite, Good, Average, and Poor—that aligned closely, though not perfectly, with raw speed rankings. These clusters were visually supported by both the canonical variate plots and the lap-speed scatter patterns, demonstrating that lap-by-lap performance profiles (not just overall speed) differentiate players. The cluster assignments also echoed patterns found in the MANOVA results, suggesting a coherent underlying structure in how subjects navigated the courses.
Third, PCA on kart attributes identified a dominant axis of variation (PC1) capturing a trade-off between agility-oriented attributes (acceleration, mini-turbo, handling) and power-oriented ones (weight, traction, top speed). Multivariate regression using PC1 revealed meaningful effects on lap performance: karts higher on agility tended to perform better on later laps, whereas heavier, faster karts tended to excel earlier but showed diminished gains by lap three. Because players generally improve across laps, this pattern suggests that agility-focused karts may be more advantageous for experienced players who can capitalize on handling benefits, while heavier, faster karts may be easier for beginners who are still learning track geometry.
Together, the multivariate tools (MANOVA, canonical correlation, clustering, PCA, and multivariate regression) provided a coherent framework for evaluating performance determinants in a complex experimental setting. Nonetheless, the study faced limitations. With fourteen participants, four courses, two race speeds, and a wide range of characters and kart combinations, the degrees of freedom were limited, constraining the use of more sophisticated fully-crossed models. Repeating courses across multiple trials or reducing the number of kart configurations would have strengthened inference and allowed for more robust modeling of subject-specific random effects. In addition, the limited coding coverage from SAS to compute a random effects MANOVA model was an unforeseen consequence from our experimental design, forcing our model to include subjects as a fixed effect. Despite these constraints, the methods employed were sufficient to detect meaningful course, kart, and speed effects, and to classify racers into interpretable and practically relevant skill groups.