Last Updated: 25 May 2026
Table of Contents
Abstract
Online reviews contain far more information than just a star rating. In this project, I used ordinal generalized linear models (GLMs) to predict Amazon ratings for Statistical Inference by Casella and Berger using reviewer metadata and features extracted from review text. Several ordinal regression approaches were explored, including cumulative logit, adjacent category, and continuation ratio models. The final selected model was a reversed cumulative link logit model with proportional odds. The results suggest that review sentiment, discussion of physical damage, and positive comments about the book’s content are among the strongest predictors of Amazon ratings. Using 5-fold cross validation, the model achieved reasonably accurate predictions while remaining highly interpretable.
Introduction
Amazon review text can be noisy, emotional, yet surprisingly informative. A one-star review may complain about damaged pages, while a five-star review praises clear explanations and strong examples. The question is whether these patterns can be quantified statistically.
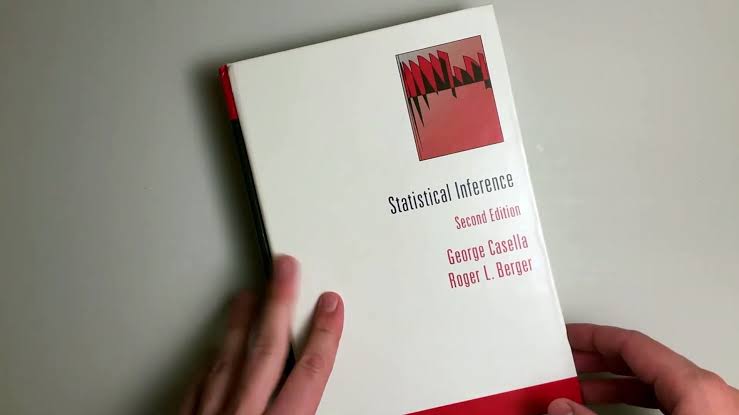
For this project, I analyzed Amazon reviews for the textbook Statistical Inference by Casella and Berger using ordinal regression methods. Because star ratings naturally form ordered categories (1 through 5 stars), ordinal GLMs provide a more appropriate framework than standard linear regression.
The primary goals of the analysis were:
- Predict star ratings from review text features
- Compare several ordinal regression approaches
- Interpret which review characteristics most strongly influence ratings
Methodology
Text Mining
I converted the raw Amazon review text into structured predictors that could be used in an ordinal regression model. Each review was first tokenized into individual words, lemmatized so related word forms were treated similarly, filtered to remove stop words, and then matched against sentiment dictionaries and custom topic dictionaries. I also extracted timing information from the review date, including the month, year, and an engineered months_from_semester_start variable to capture whether reviews tended to occur near the beginning of academic semesters. Because many of the text features were counts, I log-transformed the skewed count variables and standardized the numeric predictors before fitting the model.
I decided to engineer my variables to encompass three broad themes: sentiment, book content, and physical condition. Sentiment features included positive and negative word counts, review polarity, and the intensity of negative critque, which together summarize whether a review sounds positive, negative, or intensely critical. Content-related variables captured whether reviewers discussed the actual statistical material, explanations, examples, rigor, or usefulness of the textbook. Condition-related variables detected whether reviews focused on shipping, book quality, damaged pages, misprints, unauthorized editions, or similar issues. These engineered features allowed the model to distinguish between someone disliking the content of the statistics textbook and someone simply receiving a physically damaged or suspicious copy.
There were many variables I created, but the key variables I will highlight in this post include:
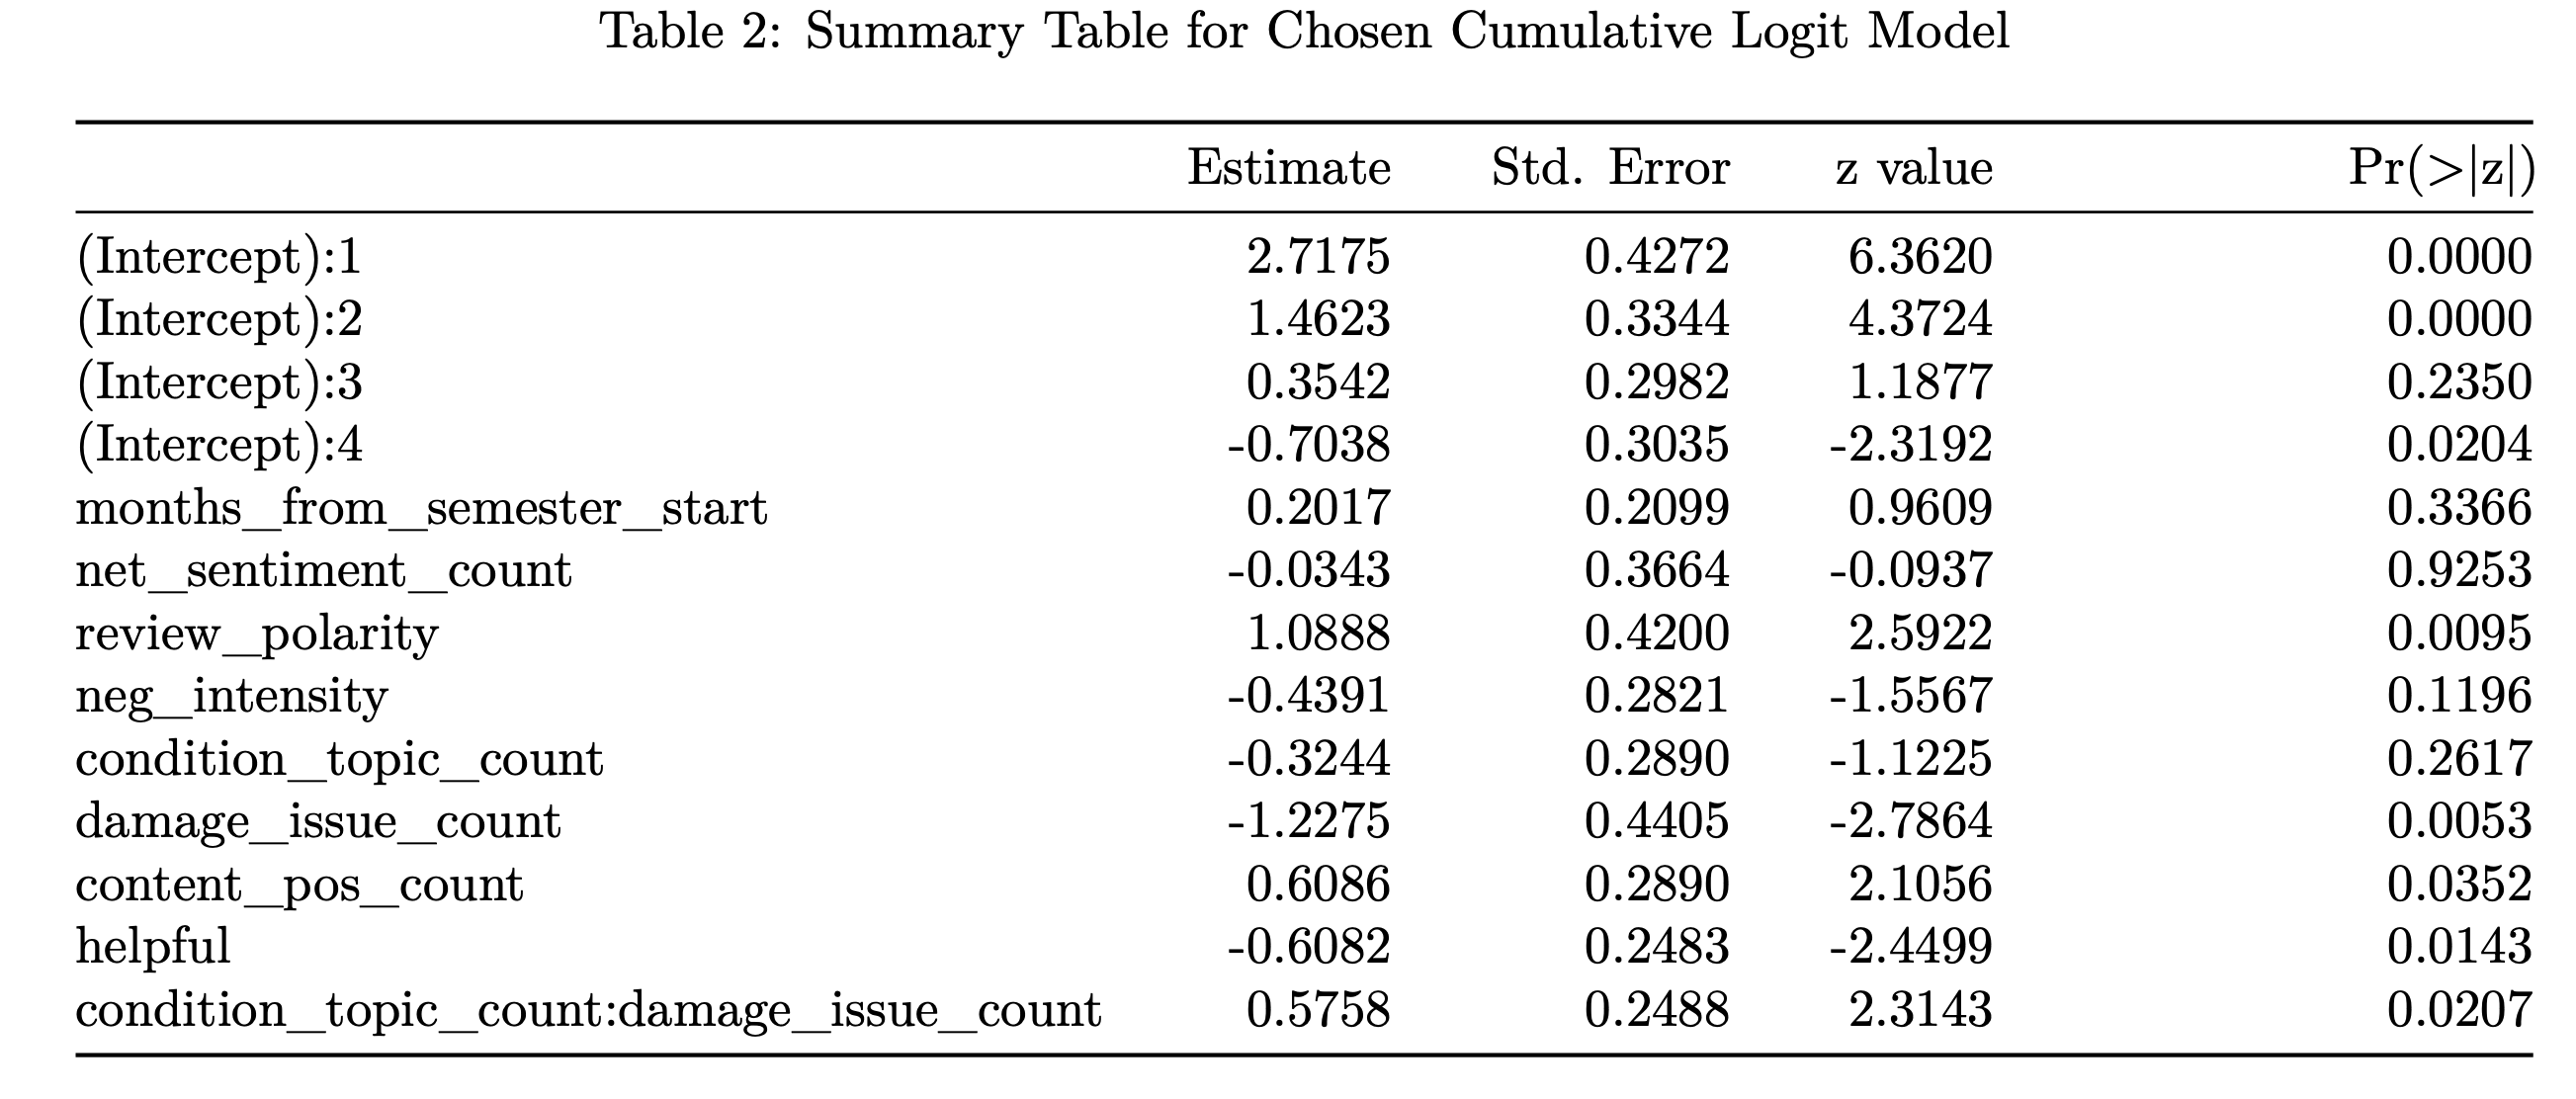
months_from_semester_start: approximate timing relative to academic semestersreview_polarity: overall positivity of review languagenet_sentiment_count: balance of positive versus negative wordsneg_intensity: strength of negative wordingcondition_topic_count: mentions of physical conditiondamage_issue_count: mentions of torn pages, folds, highlighting, etc.content_pos_count: positive discussion of the textbook’s contenthelpful: number of helpful votes received Interaction between condition discussion and damage complaints
Regression Methods
Because Amazon ratings are ordered star categories, ordinal regression models are a natural choice. Unlike ordinary least squares regression, ordinal models explicitly account for the ranking structure of the response variable.
Several ordinal GLMs were explored:
- Cumulative logit models
- Adjacent category models
- Continuation ratio models
The cumulative logit model ultimately provided the best combination of interpretability and predictive performance.
Cumulative Logit Model
The selected model used a reversed cumulative link logit model with the proportional odds assumption.
The cumulative logit model estimates:
\[log(\frac{P(Y > j)}{1 - P(Y \leq j)}) = \alpha_j + X^T \beta\]where
- $Y$ is the star rating
- $j$ indexes cumulative rating thresholds
- $\alpha_j$ are intercept terms for each star category (also can be thought of as the base odds for each star rating)
- $X^T \beta$ represents the predictor effects
Under the proportional odds assumption, the predictor coefficients remain constant across rating thresholds, which helps with both interpretability and reducing model complexity. This particular setup means that positive coefficients increase the probability of receiving higher ratings, while negative coefficients increase the probability of lower ratings.
We can implement this model in R with:
library(VGAM)
my_mod <- vglm(stars ~ ., family = cumulative(parallel=T, reverse=T), data = data)
Adjacent Category Model
The adjacent category model compares the odds of neighboring categories directly. Rather than modeling cumulative probabilities, it models transitions between adjacent ratings such as 2 stars versus 3 stars. This approach can be useful when distinctions between nearby categories are especially meaningful.
Continuation Ratio Model
The continuation ratio model treats categories sequentially. It models the probability of progressing beyond a category given that lower categories have already been passed. This framework is often useful when categories represent stages or ordered decision processes.
Results
Cross Validating Predictions
Model performance was evaluated using 5-fold cross validation:
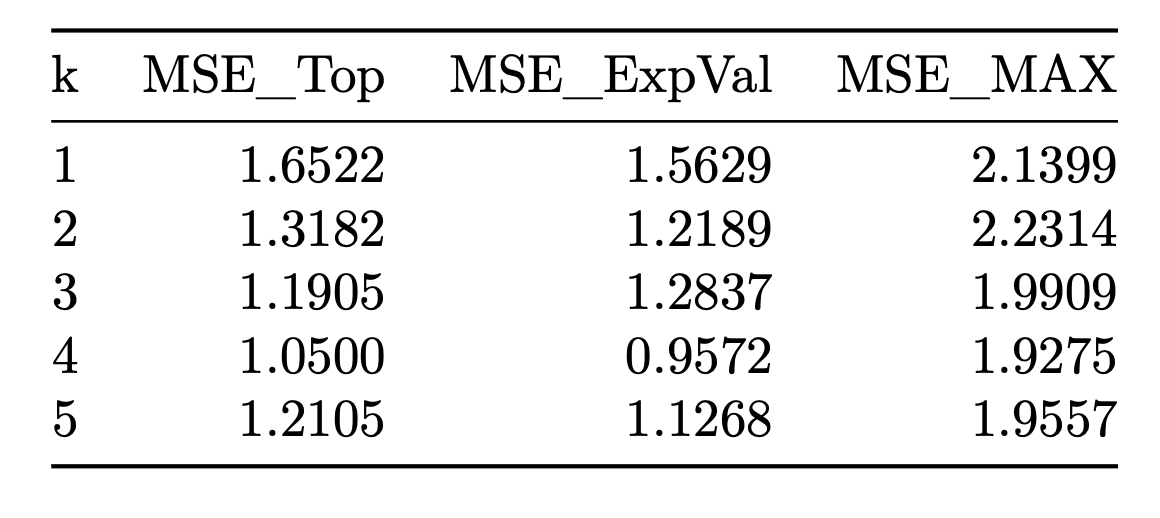
Because the model predicts stars at a continuous value between 1-5, we can choose to analyze our predictive accuracy in two differing ways. When rounding the prediction to the nearest star/integer (MSE_Top), the model achieved an average mean squared error of roughly 1.3 stars. Not rounding the star (MSE_ExpVal) had an average MSE of 1.2. Both suggest that predicted ratings were typically about one star off from the observed rating. The model performed particularly well at identifying highly positive reviews, though it was somewhat less sensitive to lower ratings.
Interpretations
The selected model had the following coefficients and respective tests: